Market Wrap as of March 17 : The Russian Bear
March, 17 2014With all of this in mind, we would love to have the opportunity to serve you, be a part of your trading team, keep you out of harms way and present you with some great trading opportunities, high reward strategies that we’ve studied carefully before releasing to our clients.

It was risk off in markets this week as emerging market concerns continued to weigh heavily on investors. Voters in Crimea gone to the polls this weekend to decide on breaking away from Ukraine and to therefore cement politically Russia’s apparent military takeover of the region. Rhetoric on all sides continues to heat up including between Russia and Western powers, steadily elevating the chances of a serious confrontation. Consequently, investor jitters are worsening, particular in Europe. Moreover, with the eurozone’s economy already quite fragile, another recession raises the serious risk of an even more destructive deflation cycle in the medium term.
Meanwhile, the more general EM economic worries remain even aside from the Ukrainian crisis. China continues to show signs of slowing and uncertainty over its financial stability persists. Brazil appears on the precipice of recession as it continues tightening monetary policy to fight inflation and currency instability. And EM more broadly faces turbulence from capital outflows as the Fed continues to taper.
Despite all these reasons for investors to raise serious questions about this year’s global improvement story, there is arguably little sign of grave concern. To be sure, stocks have begun 2014 “choppily” and EM equities continue to underperform. But typical indicators of fear (such as the VIX) remain at impressively benign levels. So perhaps investors are simply discounting the more severe tail risks.
Cooler heads will prevail in Ukraine and policy will prove nimble in China. Or perhaps, the view is that the advanced economy recovery is sufficiently resilient to prevent a relapse, with the large economies able to decouple from EM fragility. Let’s hope so. Because if investors find they were being overly complacent, the “reassessment” could prove quite painful.
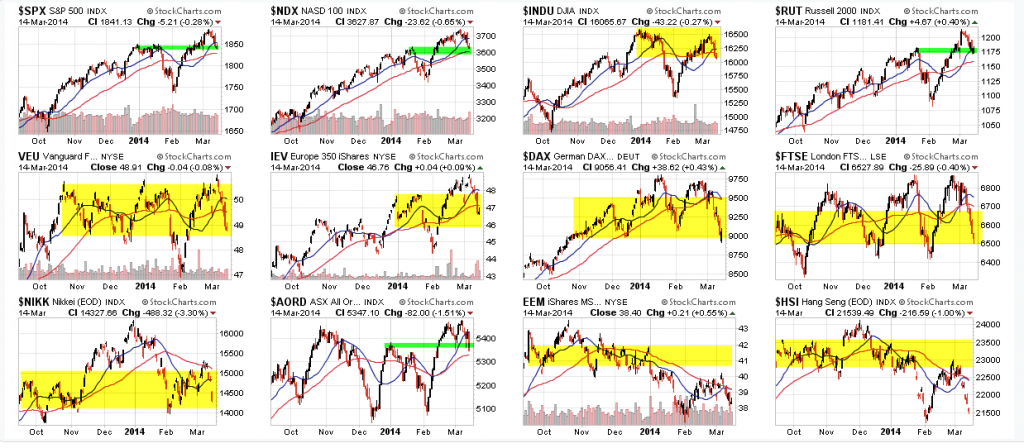
Equities: Mounting concerns over a possible escalation of the crisis in Ukraine, as well as worries over China’s slowdown, eroded risk appetites, sending equities broadly lower.
Last week, the trend remained bullish, but there were a number of signs that the torrid pace over the prior month had reached the point of exhaustion. At Friday’s close the eight markets on our world watch list turned in their worst collective weekly average of the past two calendar years, an eye-opening -3.19%. All eight posted losses for the week, with the Mumbai SENSEX down the least at -0.50%. The S&P 500 was a distant second at -1.97%. Japan’s Nikkei was the biggest loser at -6.20%.
Bonds: The week’s risk-off trade sent investors to the safe haven of G7 government bonds, pushing yields sharply lower.
Currencies: JPY strengthened sharply as the BoJ passed on further easing. EUR continued to rise, topping 1.39 for the first time since October 2011 and leading to a notable elevation of concern from ECB officials.
Bitcoin: Adding Insult to Injury (The Patient’s Already Mortally Wounded)
The Japanese government said it plans to regulate bitcoin as a commodity (not a currency). Securities firms will not be allowed to broker bitcoin trades, and banks won’t be permitted to handle bitcoins, but the government will tax bitcoin transactions.
I suspect the final post-mortem on bitcoin is likely to show that it was a massive pump-and-dump operation: a shadowy person/consortium created a “virtual currency” which attracted almost a billion dollars of real money, several hundred million of which was then siphoned off (stolen) through a software “bug”.
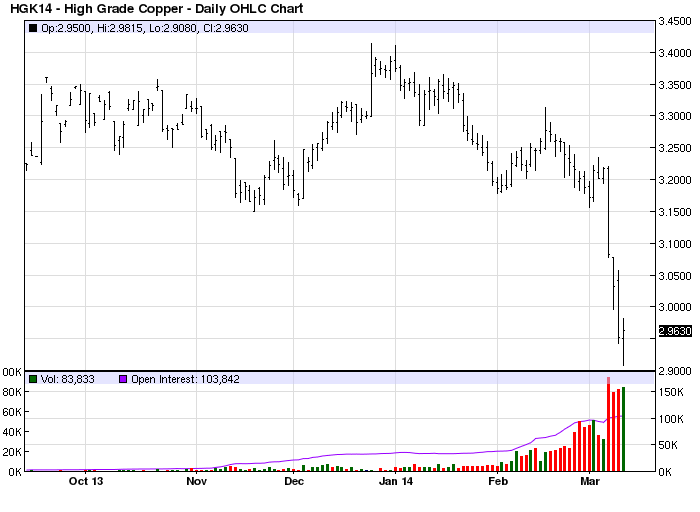
Commodities:Gold retained its safe haven bid, while oil joined industrial commodities lower on global growth concerns. Meanwhile, concerns over China’s slowdown are mounting as highlighted by the severe downdraft in industrial commodity prices. Industrial commodities have been the hardest hit by China’s slowdown. Prices for copper, iron ore, aluminum, lead, zinc, and coal have declined in recent weeks. Iron ore and copper are considered to be barometers of the Chinese economy, the world’s top consumer of both. Currently, China’s consumption represents 66% of global demand for iron ore, and 44% for copper. Copper perhaps most notably has plunged over 10% in just the last week to its lowest since 2010.
Not all commodities tied to China, however, have declined. Soybeans, for example, have risen to five-month highs; currently China’s share of global demand is roughly 44%. Data also shows that China demand for soybeans is on the rise.
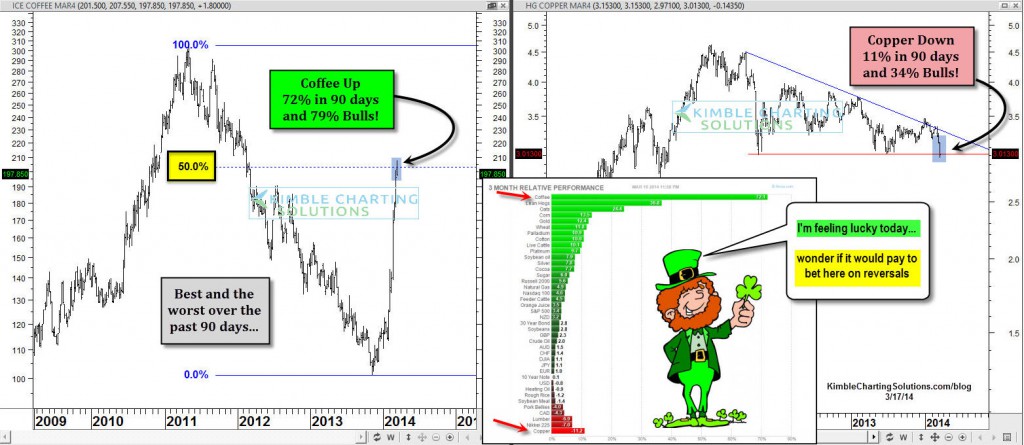
Copper or Coffee: Feeling Lucky Today?
The Bottom Line
In recent months, investors have turned their attention to one of the largest commodity consumers in the world: China. Many attribute the most recent commodity supercycle as a byproduct of China’s emergence. Subsequently, analysts have pointed to China’s slowdown as one of the biggest contributing factors to the market’s recent decline.
Though China’s economy is still growing, the country is nowhere near the double-digit growth figures it once enjoyed. Analysts estimate China’s economy will grow 7.5% this year – the lowest GDP growth rate in over a decade. Already, commodity traders are seeing the impact of the nation’s slowdown.
Equity investors should consider taking the China’s Copper Carry Trade unwind seriously. Why? Because a reduction in copper demand can indicate a potential global slowdown looming. Thus, spotting copper carry trade unwinds can be a valuable “leading indicator” for global equity market investors.
How the Copper Carry Trade Works
China imports a lot of its copper from the LME. Much of this imported copper is used as “collateral” to finance investments in other risk asset classes as part of the carry trade. From Bloomberg on Friday March 7 2014: “Copper stockpiles tracked by the Shanghai Futures Exchange gained 4.6 percent to 207,320 tons last week, the highest in 10 months. On the LME, orders to remove the metal from warehouses slid to the lowest since April.” While anecdotal, I can not underscore enough how important this observation may be. Nor can I underscore how privileged I am to be able to spot the beginning of this significant carry trade unwind, rather than with the benefit of hindsight vision.
Copper futures crashed more than 4% on Friday in response to the copper stockpiling news. The copper stockpiling news the previous Friday appears to be a precipitating trigger to the next leg in “The Great Unwind” in Copper prices that first got underway in August 2011.
China is likely the largest LME customer in the world.
Demand for copper by Chinese businesses and Chinese investors had to fall off a cliff last week for copper stockpiles to grow almost 5% in a week.
China has been preparing for several years to allow various malinvestments/businesses to fail. 2014 demarks the onset of debt restructuring reform policies in China. That is, the PBOC is no longer going to infinitely backstop malinvestments for which China is so famous for permitting. But now, China is going to allow some malinvestments to default. The first Chinese default began last week with a Shanghai Solar company failing to pay interest on its bonds. Coal companies are also expected to be allowed to fail later this year
The plunge in copper demand in China last week happened concurrently with a major Chinese company defaulting on its bonds. Coincidence? Maybe, but maybe not. It could be that investors have suddenly become disenchanted with their copper carry trades if the PBOC isn’t going to be there to backstop a lot of malinvestments.
Anecdotal Chinese Export Observations
And the narrative in China only deteriorated further this morning with Bloomberg reporting that Chinese “exports fell the most since the global financial crisis. Shipments dropped 18% from a year earlier.” Bloomberg cautions about putting too much emphasis on the yoy drop in exports because “Distortions in the data from the fake invoicing that inflated numbers last year make it harder to assess the true picture.” Nevertheless, GDP growth momentum is slowing in China, and export demand may be slowing just ahead of the US, Russia, and EU potentially igniting trade wars. If those trade wars between Russia, the US and EU eventuate, this will only exacerbate further the slow down in global trade over the near term. Meanwhile, a slowdown in Chinese export demand implies more Chinese businesses will fail than would transpire during a pickup in global trade and export demand. So, should it be any surprise that Chinese investors are suddenly unwinding their copper carry trades?
China’s appetite for physical gold remains insatiable.
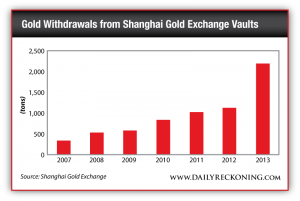
According to the China Gold Association, 2013 consumption rose by 41% year over year, to a record 1,176 tons. That’s impressive. Even more impressive is another indicator of demand…
“Another way to measure the real total demand for gold in China is the amount of gold being withdrawn from the vaults of the Shanghai Gold Exchange (SGE),” writes CLSA strategist Chris Wood in a recent note. “On this point, gold withdrawals from the SGE vaults rose by 93%, to 2,197 tons, in 2013, according to the exchange [see the figure below]. It should be noted that imported and mined gold are required to be sold first through the SGE.”
It’s a fact that in a secondary market (like stocks), for every buyer of an asset, there has to be a seller. That’s why you should ignore the market cheerleaders’ comments about “cash on the sidelines” or money “going into or out of” an asset class. Such comments assume there’s just one side in a two-way market. The urgency of the investor to buy or sell relative to the urgency of the other party determines price.
So what party sold physical gold so urgently in 2013 that it overwhelmed Chinese demand, pushing the price lower? Our guess is the liquidation from gold ETFs in the U.S. The decline in GLD exceeded the decline in gold futures in the US
Warnings Signs Of Stock Market Exuberance
A number of warning signals are flashing in the stock market, and while not indicative of an imminent crash, they’re telling investors to exercise caution, say market strategists.
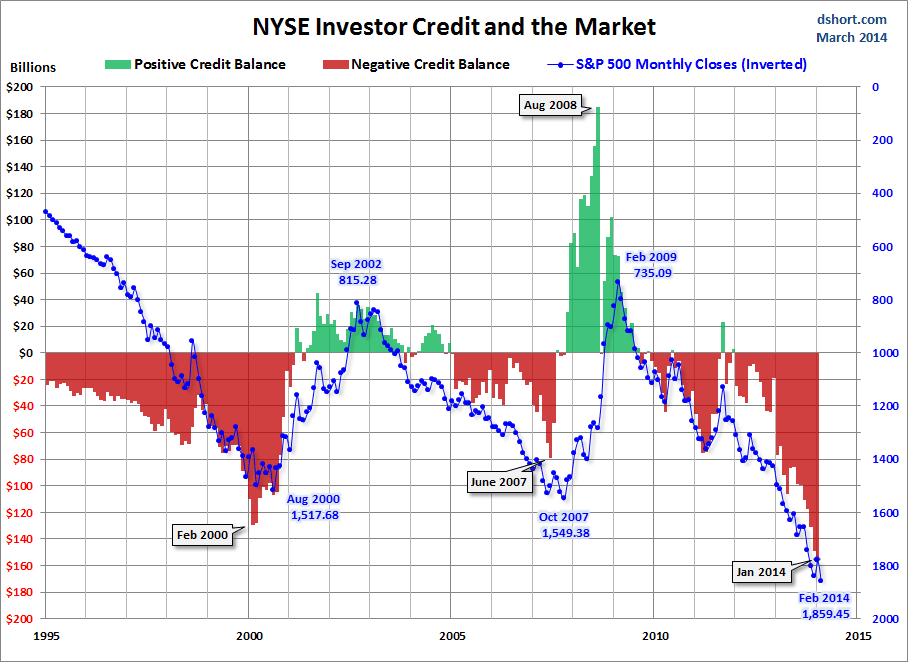
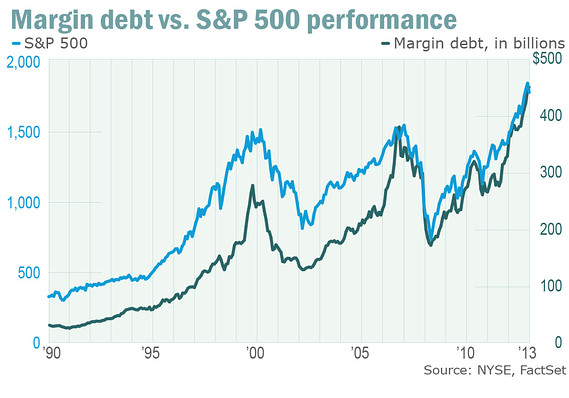
This year gains haven’t come without a share of fretting that the good times can’t last. Among the warnings signs: The indexes’ string of record highs; high levels of margin debt, or borrowings to finance stock buys; the slim number of prior bull markets that have lasted past this point; and valuations that are close to levels when stocks last peaked.
Margin debt, which tends to spike alongside stock rallies and pullbacks, has been rattling investors for months. As that debt goes up, the market’s foundation gets shakier and shakier. The correction could be deeper.
What is troubling is that much of the buying is being fueled by cheap debt. While no formal definition of a “bubble” exists. Margin debt hit record levels at the end of January, Margin debt at the end of January reached $451.3 billion, its fifth record month in a row. Margin debt returned and surpassed record levels set in July 2007 back in April when it topped $384.37 billion.
Albert Edwards of Societe Generale has just published his latest bearish message to his readers.
He warns of the “double threat of Chinese renminbi devaluation and complacent investor expectations.” We’ll take a look at the latter.
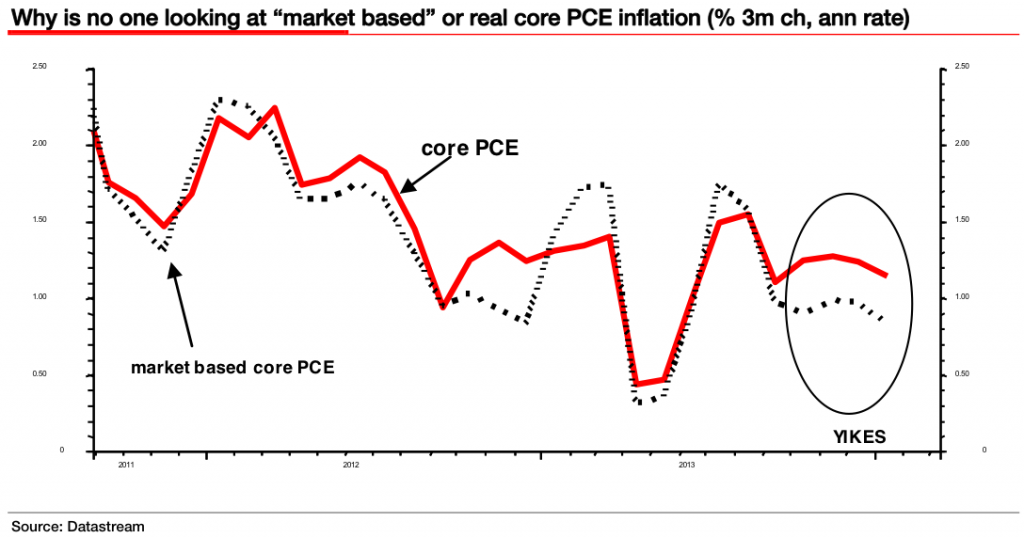
“This week our preferred market-based measure of US core PCE (personal consumption expenditure) slumped well below the core PCE rate the market focuses on,” writes Edwards, who has long warned the U.S. is on the brink of all-out deflation.
He begins by relaying a message from the bond king Bill Gross:
Bill Gross at Pimco hit the nail on the head earlier this year when he said “I am amazed at the fascination and emphasis placed on the u-rate during employment Fridays. Bond prices will move (in some cases by points) with a minor up or down change in unemployment relative to expectations, but when it comes to the third pig in the litter – inflation – no one seems to care. PCE is the Federal Reserve’s preferred measure of inflation, and it’s been telling us the threat of inflation has been falling.
“Yet despite deflationary reality, 10y implied inflation expectations have not budged at all,” he continued. “Indeed on a 5y basis, implied inflation expectations seem to be drifting upwards! The gap between reality and expectations (or hope) just gets wider and wider!”
Deflation is a scary thing. When prices are falling, consumers are encouraged to wait for even lower prices. This often forces businesses to lower prices even further in their efforts to spur demand. Meanwhile, profit margins collapse, layoffs ensue, and the economy spirals.
On top of all that, the economic data has been disappointing.
“The US economic surprise indicator as calculated by Citigroup is seeing the weakest start to the year since 2008,” he noted. “Investors have decided to dismiss this weakness as wholly weather-related. The danger to the market is that as the weather improves the data does not, and both the equity and bond markets (viz inflation expectations) find themselves in totally the wrong place.”
Then again, if the economy is indeed improving, we’ll get the activity that ultimately leads to higher prices. Indeed, there are actually some strong anecdotal signs that inflation may already be picking up.


