Market Wrap as of January 20
January, 20 2014Same Old Song and Dance
As the African proverb says, “when the music changes, so does the dance.” We expect to thrive when the music stops. For now, its the same old song and dance.
Harry Truman once famously asked for a one-armed economist, one who couldn’t say “but on the other hand…” On this score, while there were no real surprises or new insights in its minutes, the FOMC is an octopus with an extra arm: the minutes paint the picture of a committee with a range of views on every question – the antithesis of consensus. If decisions are, as the Fed continually reminds us, data-driven, and if there’s no consensus on the committee, how much weight should you put on the Fed’s forward guidance? I suspect the message is: not too much.
If decisions are, as the Fed continually reminds us, data-driven, and if there’s no consensus on the committee, how much weight should you put on the Fed’s forward guidance? I suspect the message is: not too much.
On the US monetary policy front, now that tapering has begun the primary question is when the Fed begins raising administered rates. The clear signal out of the FOMC is that there will be no hikes until mid-2015 at the earliest.
The FOMC Minutes Drew Little Market Reaction, but Contained Hidden Message

The reason the FOMC felt comfortable taking its step is that most members believe that the unemployment rate likely understates the amount of slack in the labor market because it is being depressed by a marked drop in labor force participation, some of which may be only temporary. Our own analysis supports this view. Indeed, if we control for the decline in participation of just this cohort (i.e., assume that folks in their prime earning years who have left the labor market will eventually come back), the unemployment rate would be a materially higher 8.5%, still well above the 6.5% threshold. Consequently, the case for leaving administered rates low for quite a while yet appears quite defensible.
Non Farm Payrolls
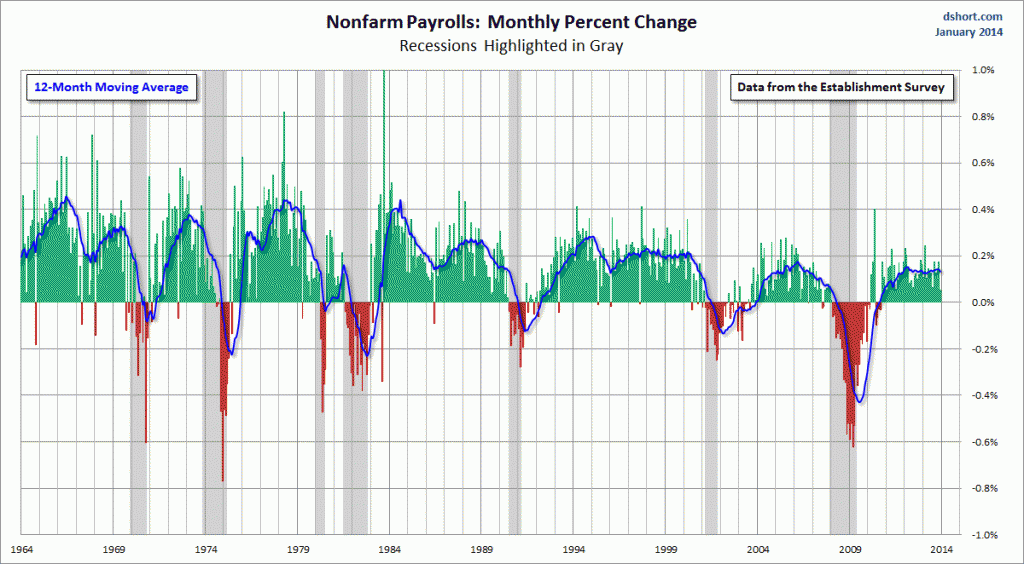
A look at the data over the past 50 years confirms the view that the month-over-month change at any point in time is meaningless. Here is a 50-year chart of the monthly percent change in this highly regarded economic indicator, including a 12-month moving average overlay.
Our general tendency in studying economic data is the look at the long-term trend. What we find most interesting the chart above is the moving average. In addition to smoothing the volatility, it shows us an interesting phenomenon. Over this timeframe, the MA highs have been progressively lower since the peak in the late 1970s. The change has been gradual and is no doubt in part a reflection of the demographics of the Boomer generation. However, over the 10-15 years, the trend has also been impacted by the efficiencies of technology and the globalization of the economy, which continues to put pressure on national employment data.
In past business cycles, the 12-month MA has generally sloped downward for several months before recessions start. The one conspicuous outlier is the second half of the 1980s double-dip recession, which was essentially engineered by the Fed to break the back of runaway inflation.
At this point it is impossible to see Nonfarm Employment as a harbinger of the business cycle contraction. But the 12-month MA of this indicator is one we’ll want to watch closely in the months ahead.
They Shoot Horses. Don’t They ?
In Europe, the Troika has rejected Greece’s 2014 fiscal plan. However, Greece does not face a bond maturity until May, which means that it can afford to drag out the negotiations. There is increased talk of a cabinet reshuffle in Greece and Syriza is demanding an election next month. The Greek stock market was among the strongest in Europe last year and had has begun this year on strong footing as well.
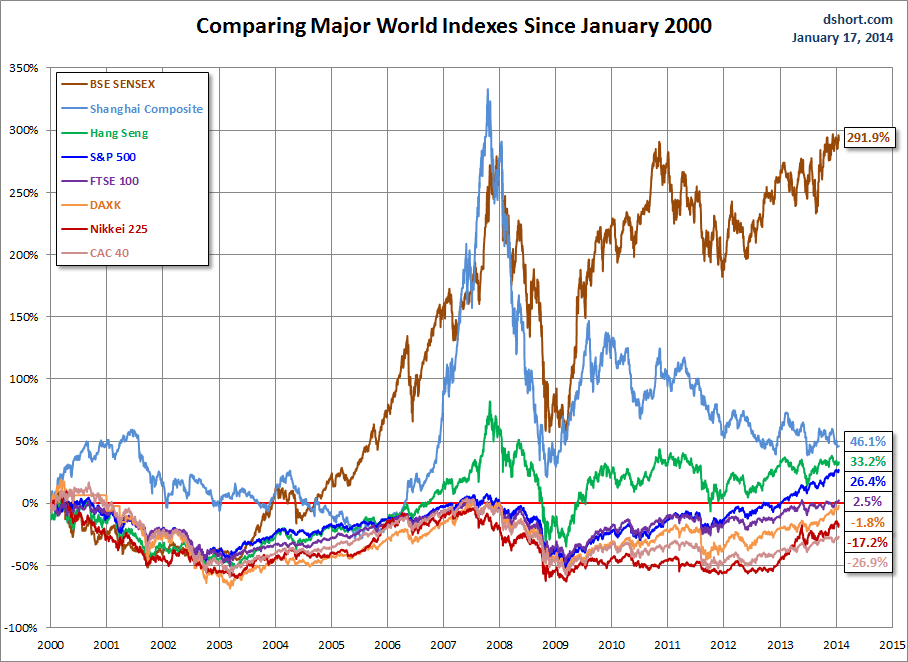
Equities: Equities are mostly higher on a fair start to the earnings season. Over the past week, five of the eight indexes on my world markets watch lists posted gains. Germany’s DAXK was the standout with a 2.85% advance, followed by France’s CAC 40, up 1.81%. India’s SENSEX, the UK’s FTSE 100 and Hong Kong’s Hang Seng were clustered in the 1.26%-1.47% range. The S&P 500 fared the best of the weekly losers, down a fractional 0.20%. Japan’s Nikkei 225, last year’s stellar performer, fared worst, down 1.12%, although that’s an improvement from its 2.33% selloff the previous week.
Bonds: Benign, and in some cases very low, inflation readings supported the fixed income bid this week. Dovish signals from the ECB helped eurozone bonds, while Aussie bonds showed the strongest rally following a poor jobs print.
Currencies: CAD and AUD continued to weaken—the former now at its weakest since September 2009 and the latter July 2010. EUR also fell on dovish rhetoric out of the ECB.
Commodities: Oil and gold are little changed on the week.
Generational Opportunity in Gold Mining Stocks
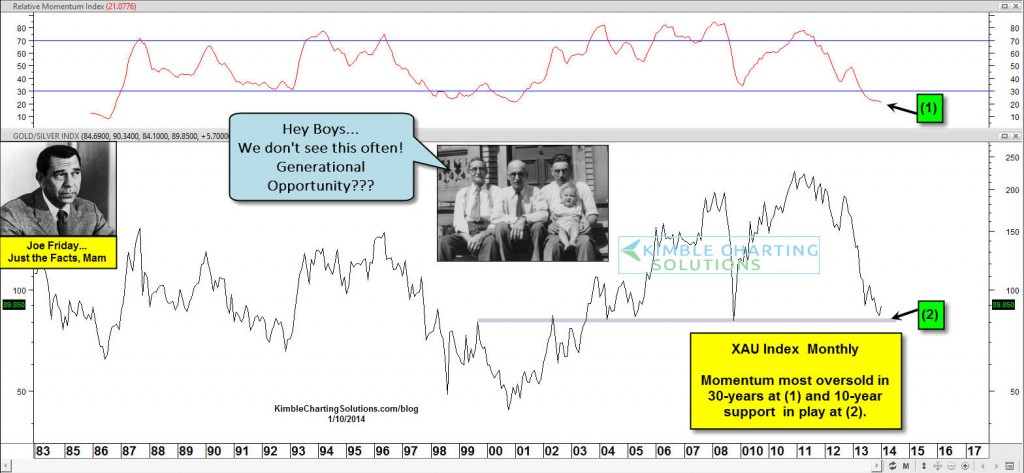
Three weeks DOES NOT make a trend! But what a difference 30-months can make! 30-Months ago the Power of the Pattern shared that Gold could be flat to down for years to come. Its not been too pretty for metals since that time frame, as Gold has lost one third of its value.

The decline in Gold & Silver has helped pushed the Gold/Silver mining index (XAU) momentum indicator to levels not seen in 30-years at (1) below. Todd Shriber of ETF Trends writes this morning, this could be a “Generational Opportunity in the miners” index (see article here).
The decline in the XAU index has pushed it to a level that has been key support/resistance several times over the past 10-years.
Tips of the Year 2014
In fact, when the strategists first made their market calls at the end of 2012, the highest price target for the S&P 500 was 1,615, some 13% below the year-end close. What caused such a gross miss? Were earnings so much better than they had predicted? To the contrary, the average earnings estimate made back in 2012 for the year 2013 was $101. 2013 is now expected to register $99 in reported earnings when the dust settles. Changes in valuation — the expansion of price multiples — drove the difference. Analysts expected the S&P 500 to trade for 16.1x earnings and instead the index closed 2013 trading for 18.7x earnings. Other valuation metrics registered similar increases.
With many markets ending 2013 near record highs and fears mounting among strategists that valuations have become overstretched, the coming year clearly has the potential to feel like a particularly long one. The key “macro” risk as we start 2014 is the question of how governments will unwind the exceptionally loose monetary policies of recent years. However, the political pressure will be to do too little, rather than too much, to curb such policies. So worries about the impact of tapering in 2014 may ultimately prove overblown.
As for 2014? Our best guess is that equity markets will rise again as the economy continues to grow and operating margins expand in the latter portion of this economic cycle. Returns should be more modest as price multiples are already high. Even Wall Street’s preferred metric, the forward P/E, is 10% above its 10-year average and 20% above its 35-year average.
Though, at this point, there is actually a “risk” to under-invested managers. In typical end-of-bull-market fashion, investors will likely fail to comprehend that profits are approaching peak levels and place unduly high multiples on those earnings. So long as the economy continues to expand, markets may well rise another 20% to 30% over the next two years in this scenario.
We have forecasted modest 10-year returns for the last couple of years and yet the market has risen an average 24%. It will take another eight to ten years to be proven wrong or right. For now we say that returns have been pulled forward and thus future returns–based on the logic of math–will be even lower.
With each year that passes, we come closer to the inevitable: recession, bear market, and with it, steep losses for the unprepared.
And yet, we remain confident in our positioning. This has everything to do with the composition of our portfolio, our expectation for the economy, and the fluidity inherent in our investment process.
Our investment strategy, implemented through our sound process, has inherent flexibility. In near automatic fashion, our process shifts our positioning as valuations change, macro risk rises, and the opportunity set evolves. That, combined with our prowess in security selection, should limit our downside as this market cycle eventually comes to a close.


