Market Comments as of November 4 : Ursus Extinctus ?
November, 07 2013Ursus extinctus ?
It continues to be untrue that ‘no-one likes this market’. In fact, we don’t know about any other year in which the market has been loved as much as in 2013. We can see it in this year’s Barron’s ‘big money polls’, we can see it in sentiment surveys and in actual positioning data, including record high margin debt.
Of course the bears have been quite wrong so far this year. Simply following the herd was clearly the thing to do (and it should be noted that since sentiment is in large part a function of price trends, one should expect sentiment to be net bullish in uptrending markets). Nevertheless, when sentiment and positioning data consistently produce new extremes month after month, it tells us that the eventual backlash is likely to be quite a doozy.
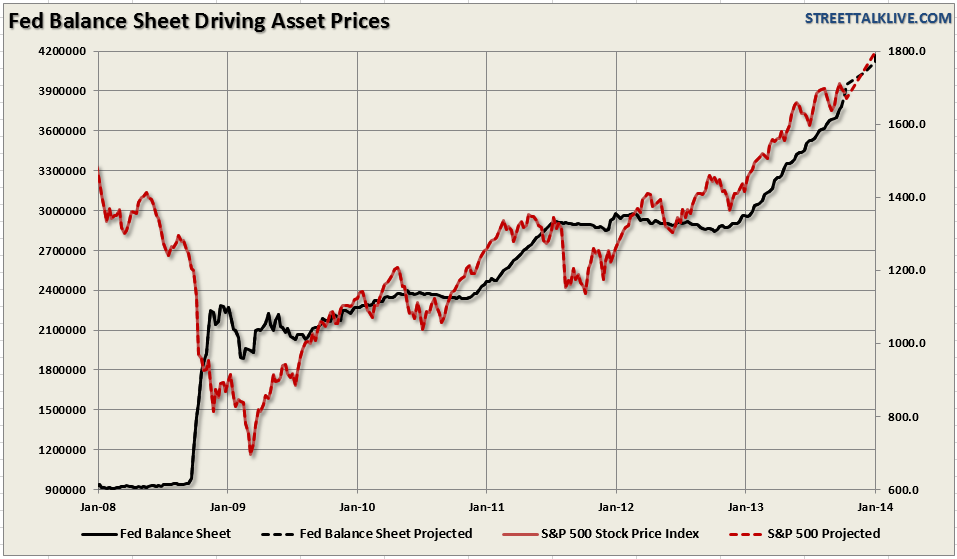
The financial markets have long been seen as a gauge of future economic activity. As the stock market rises the economy has also risen. However, that has not been the case over the last several years with the economy stuck at a sub-par rate of growth. Today, with the high degree of correlation between the Fed’s balance sheet and the financial markets, it is getting increasingly difficult to make the case that the markets are reflecting anything but themselves.
The increase in the monetary base in the form of idle excess reserves. There is a credit crunch, as banks with insufficient capital do not want to lend to risky borrowers, while slow growth and high levels of household debt have also depressed credit demand.
As a result, all of this excess liquidity is flowing to the financial sector rather than the real economy. Near-zero policy rates encourage “carry trades” – debt-financed investment in higher-yielding risky assets such as longer-term government and private bonds, equities, commodities and currencies of countries with high interest rates. The result has been frothy financial markets that could eventually turn bubbly.”
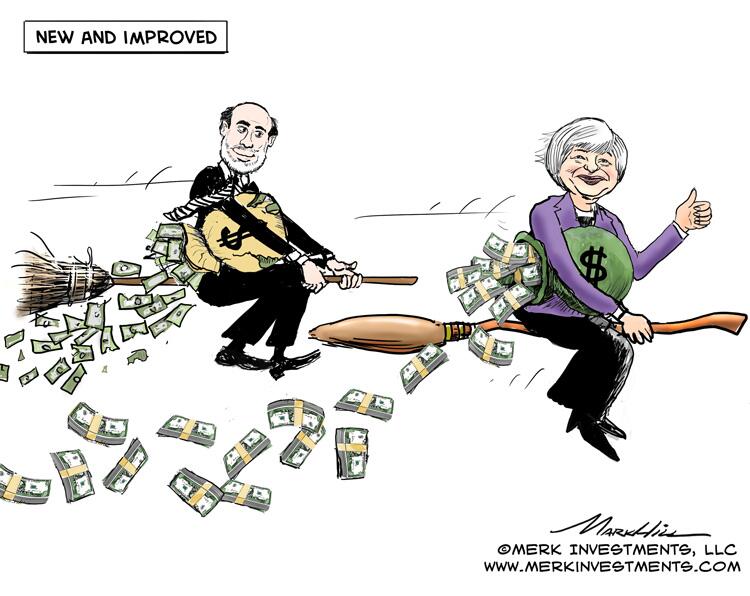
Given that money printing continues as before, it is admittedly hard to see what could trigger a reversal – but this is also a ‘hook’ that is likely to eventually mislead market participants. They have become so used to the ‘Bernanke put’ supporting the market, that they can no longer imagine that it may one day not work as advertised anymore. And yet, it is a near certainty that this day will come. Stay tuned.
QE taper back on the table.
In the 1977 Eagles song, Hotel California, a luxury hotel appears inviting and offers a tired traveller comforting relief from his journey. It turns out to be something of a nightmare, however, and he finds that “you can check out anytime you like, but you can never leave”.
Does that sound a little bit like QE and the Fed? The FOMC signalled its intention to check out of QE at its June meeting, but by September, it found it could not leave. The backup in yields that the announcement had sparked, together with worries about fiscal fisticuffs in Washington, was damaging an already not-very-vigorous recovery and hurting confidence. So, the Fed took a rain check. Is that not just like QE1 and QE2, the scheduled ends of which had to be reversed within relatively short periods?
The question now is whether or not we should expect repeated market obstacles to a QE3 exit. Infographic”Taper Exit explained”
In the wake of the Fed’s latest policy announcement on Wednesday, both bonds and stocks dropped, suggesting that investors saw something more hawkish in the central bank’s statement. The Fed made no change to administered rates, its pace of asset purchases, or its forward guidance for either. There was no change in policy, but there was a change in wording of its statement that suggested a December or January taper of Quantitative Easing (QE) might occur. There was no change in policy, but there was a change in wording of its statement that suggested a December or January taper of Quantitative Easing (QE) might occur. SEE THREE TAKE AWAY
We also don’t see any meaningful upgrade to the Fed’s qualitative assessment of the economy relative to the last policy statement in September, when the Fed defied market expectations by holding off on tapering. And in any case, the most important thing to remember is that the timing and speed of tapering is ultimately data dependent. At his press conference in September, Chairman Bernanke forcefully made this point to investors. And we don’t think there will be enough strong or clean data available over the next six weeks to convince the Fed that the economy has improved enough to warrant tapering in December.
SEE : Bubbles, Bubbles Everywhere By John Mauldin
Equities: Stocks weakened following what was clearly interpreted as a hawkish shift by the Fed. But this has done little damage to an otherwise impressive rally this year, which has been driven in large measure by easy monetary policy. Europe was up about the same, but Emerging Markets was best, up just over 1%; Japan rose roughly 0.6% (all from the perspective of a U.S. dollar-based investor.)
From Greece To Crude And Everything Inbetween:
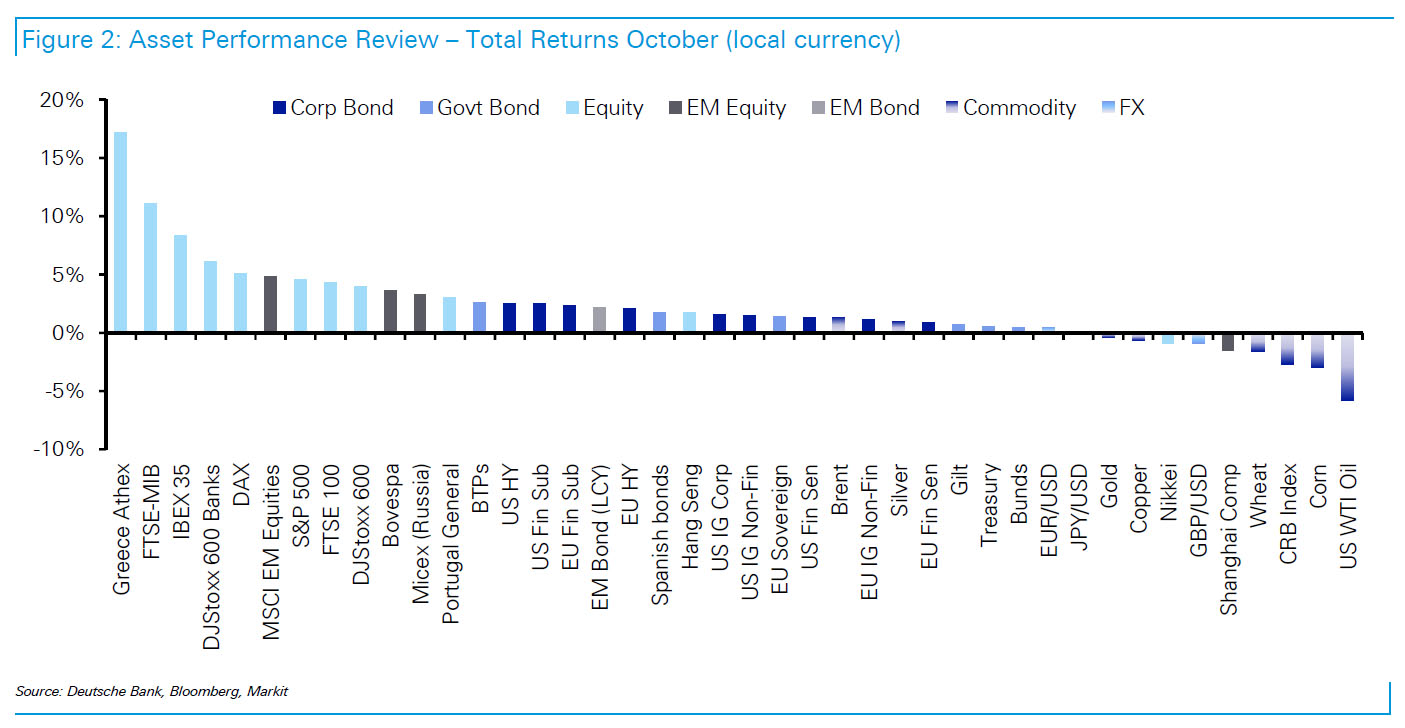
The Best And Worst Performing Assets In October, Deutsche Bank explains.
After September’s no Fed taper fuelled performance, financial markets were supported in October by the near-term satisfactory resolution of the fiscal situation in the US. Asset returns in October broadly reflect what we’ve generally seen so far YTD. Developed world equities have seeing the best of the returns while the performance of commodities has been disappointing.
October’s highlights in equities centered on the European periphery where Greek, Italian and Spanish equities returned +17.2%, +11.1% and +8.3% respectively, pushing YTD returns above +20% for Italy and Spain and above +30% for Greece. That said Japanese stocks still lead the way YTD with the Nikkei up just shy of +40% (+39.9%) despite weaker returns in October (-0.9%).
EM equities produced another decent month of returns (+4.9%) following the summer’s weakness with the MSCI EM index now back into positive territory YTD, only Chinese stocks (-1.5%) saw negative returns in October amongst the EM countries included in our review.
At the other end of the returns spectrum commodities saw further declines with the CRB index (-2.7%) seeing it’s 6th monthly decline of the year with the YTD performance of -5.8%. Although US WTI crude fell -5.8% in October it is still up (+5.0%) YTD; one of the few commodities to be in positive territory in 2013.
In terms of fixed income returns were positive across the spectrum as key government bond yields saw further declines. 10 year Treasury yields fell around 6bps to 2.55% and traded below 2.5% during October. Government bonds saw more impressive declines in Europe with the 10 year Bund and the 10 Year Gilt both down around 10bps to 1.67% and 2.62% respectively. So government bond total returns were positive with Italian BTPs leading the way (+2.6% in October and +6.2% YTD). EM bonds retraced more of the summer weakness but they remain in negative territory YTD. In credit we saw further outperformance from the higher beta part of the credit spectrum with Fin Sub and HY leading the way. GBP Fin Sub returned an impressive +3.2% in October and is up +8.9% YTD.
Bonds: Government bonds had a similar knee-jerk reaction to the perception of a more hawkish Fed. But eurozone bonds caught a bid after a very low inflation print raised the probability that the ECB may cut administered rates again.
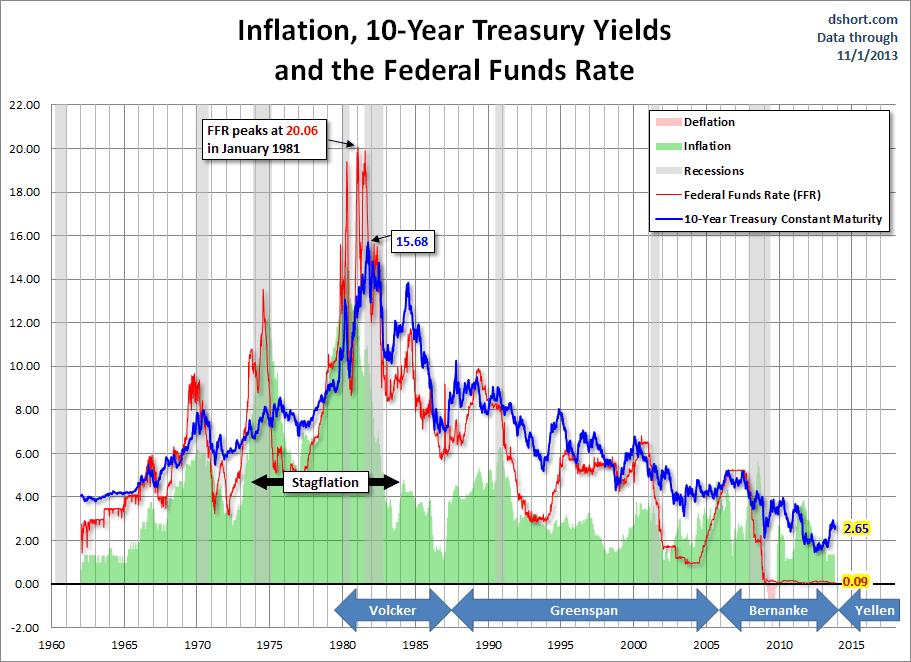
The chart below shows the 10-Year Constant Maturity yield since 1962 along with the Federal Funds Rate (FFR) and inflation. The range has been astonishing. The stagflation that set in after the 1973 Oil Embargo was finally ended after Paul Volcker raised the FFR to 20.06%.
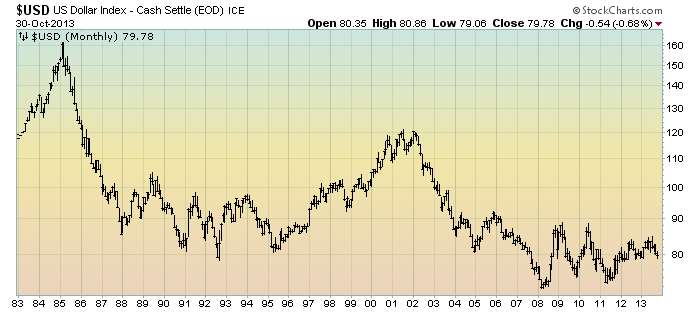
Currencies: USD was stronger on the perception of the Fed’s hawkish shift. EUR fell most sharply on bets for ECB easing. The dollar gained about 2.3% against the Euro and 1.5% against the Yen; it rallied against most EM currencies including, for a change, the Chinese Yuan.
For reference purposes, here is a monthly chart of the U.S. Dollar Index, on a LOG scale, since 1983:
The key technical development is that it finished last week above the downtrend line drawn off this year’s highs in early July and the bounce in early September. The dollar has also not violated its downtrend against the Swiss franc. Once the trend line goes, the immediate objective is near CHF0.9220. It will ultimately take a break of the CHF0.9420-50 area to raise confidence that a low of some import is in place. SEE ANNEXE USD
Commodities: Gold and oil were each down 3% for the week; oil fell below $95 for the first time since June, reflecting both higher inventories and expectation of tighter Fed policy. Brent fell to its lowest level in four months.
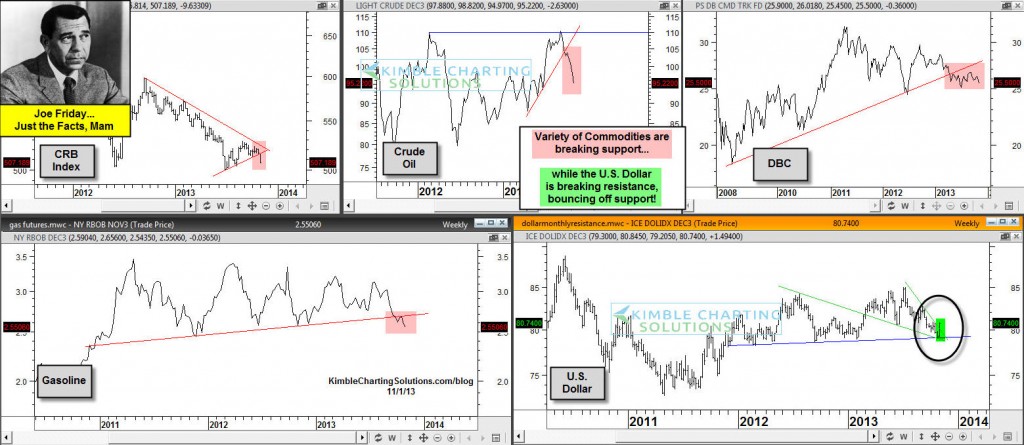
“Commodity Breakdown ; Dollar break Out! Hints of Deflation?”
Many key commodities are breaking support, ranging from the CRB Index, Crude Oil, Commodities ETF (DBC) and Gasoline futures. This has my attention, and here’s why: The majority of the time that Crude Oil & Gasoline have been soft, it may have been good for prices at the pump, but it wasn’t good for stock prices!
At the same time some of the key macro commodities are breaking down, the U.S. Dollar is bouncing off support and breaking above a bullish falling wedge.
GOLD : Buy Spot Gold at 1310, risking 1250, targeting 1450, potentially beyond
BofAML’s NacNeill Curry remains bullish gold. He notes the impulsive gains from the 1251 low of Oct-15 and break of the 2-month downtrend (confirmed on the break of 1330) imply the medium-term trend has turned bullish. We look for an ultimate break of the 1433 highs of Aug-28, with potential for a push to 1500/1533 long-term resistance. Curry suggests traders buy this dip at around 1310


