

How strong is this market?
August, 16 2022
Strength Matters
Looking at a chart of the S&P 500 might give you some cause for optimism. While stocks are down 11% year to date on a total return basis, they are up roughly 9% since reaching bear market territory in early June. Moreover, there are signs that inflation is easing, the jobs market remains relatively strong, and Q2 earnings have generally been coming in better than expected.
If you are an active investor, you may have found yourself asking if the market’s rebound from the June lows is for real. One technical indicator that can help shed some light on this question is ADX. According to ADX, the market’s momentum may have the strength to continue.
Whereas technical indicators like RSI, MACD, and stochastics can help you determine at what price to buy and sell a stock, ADX is used to help determine how strong a trend is. From an investing perspective, strength can be an important factor as it can help determine if there is momentum behind a market move.
- Average directional index (ADX) is a short-term chart indicator.
- It can be used to help you evaluate the market or an investment’s strength.
- Currently, ADX suggests the short-term momentum behind stocks may be strong.
To understand why, consider a hypothetical stock that is rising in price. Would you rather own this stock if the uptrend were strengthening or weakening? From a technical analysis perspective, a rising stock in a strong uptrend may suggest greater likelihood of continuing to rise than the same stock whose uptrend is showing signs of weakness.
How is ADX built ?
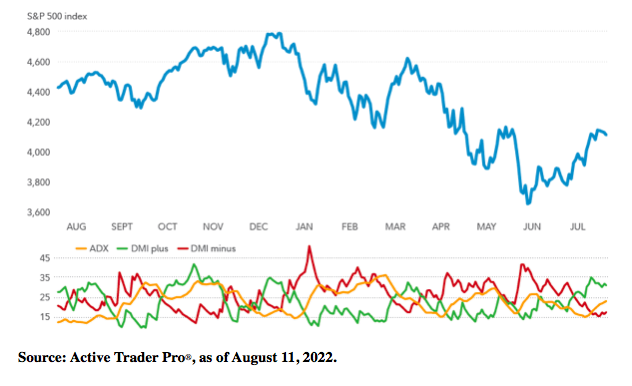
ADX is a short-term indicator that can be used under any type of market conditions (e.g., bull or bear markets, high or low volatility, etc.). It is simply the mean, or average, of the values of directional movement (DM) lines over a specified period. DM lines are calculated using current high and low prices. Much like RSI and stochastics, ADX fluctuates between 0 and 100. The bottom part of the chart below demonstrates what the ADX indicator looks like.
Unlike other technical indicators, however, readings above 60 do not occur frequently for ADX. In practice, most chart analysts believe a reading above 25 typically indicates a strong trend and a reading below 20 usually suggests there is no trend—with no clear signal interpretation existing between 20 and 25.
There are actually 3 lines in the ADX indicator. The most important one is the ADX line. In addition, there are 2 other lines: A DMI plus line (sometimes shown on charts as DMI+ or DI+) and a DMI minus line (sometimes shown on charts as DMI- or DI-). DMI stands for directional movement indicator. Whereas the ADX line determines the strength of the trend, the 2 DMI lines complement the ADX line by helping determine the trend’s direction.
How is it used ?
A rising ADX line generally means that an existing trend is strengthening. If ADX suggests the trend is strong (i.e., ADX is rising), then trend-following systems—such as moving averages and channel breakouts—are expected to have more validity. Alternatively, if you see a falling ADX line, which indicates an existing trend is weak or there is no trend, you may not want to place as much value in the signals given by trend-following systems.
The direction of the trend is interpreted as positive when the DMI plus line is higher than the DMI minus line. Conversely, the direction of the trend is interpreted as negative when the DMI minus line is higher than the DMI plus line.
Looking at a chart of the S&P 500 shows that stocks had been in a downtrend for most of 2022, but have bounced higher since mid-June. In more recent weeks, a rising ADX line (the orange line in the chart below) has confirmed the strength of the uptrend. An ADX reading near 25 also indicates this is a strong trend. Additionally, the DMI plus line is well above the DMI minus line, suggesting the direction of the trend is positive.
There are many ways that you can incorporate indicators and technical analysis into your investing strategy. One way is to use indicators and other chart techniques to supplement your overall assessment of the fundamentals of the global economy, the business cycle, and other factors relevant to your analysis.
Of course, ADX’s current reading does not necessarily mean that stocks will continue to rise. More importantly, the lingering threat of inflation, supply chain problems, geopolitical risks, and more could render chart patterns and indicators like ADX irrelevant. With that said, ADX can be used to supplement your view of short-term trends.
Until next time !
Source Fidelity Active Investor