Gold : From the Situation Room
August, 20 2013Back to Fundamentals
We are expanding on our gold stocks reco last week, we took the gold market fundamentals and adjusted the Demand/Supply numbers in line with the fall in the gold price.
All the pieces are in place for a major uptrend in gold to begin right away, and it appears to be starting as this is being prepared. The Commercials have cleared out virtually all of their short positions, for a massive profit of course, meaning that the slate is wiped clean for the game to start over anew.
“Preservation of Capital” is much more important than any other strategy in the marketplace and this has been demonstrated time and time again over the centuries. Gold, since ancient times, has served four functions.The first is for jewelry and this is a subject for lunch at the Four Seasons. This is not where we are dining today. The three other functions of gold are a replacement for a currency, an asset that rises in value in times of inflation and an asset that becomes more valuable when Fear is hard upon the market place. The substitution for a monetary system is a matter of a loss of faith. Inflation is what each and every government on Earth promulgates as long as there is not too much of it.
It is then a matter of viewpoint where you think we are now but given the sell-off in gold, the possibility of a dark swan or two beginning to trot after the German elections or the fantasy numbers pumped out of China becoming unmasked; gold is an interesting option these days.
That being said, we know that it’s been tough to be a gold investor. The yellow metal is the worst performing commodity this year, falling 21% since January 1. But the gold bulls aren’t giving up. And like everyone else, they have charts and data to support what they believe to be a reasonable investment. Enter Frank Holmes is one of the most widely respected voices in gold. Holmes recently presented at the Agora Financial Investment Symposium in Vancouver. His talk included a 71-page slide deck.
We are happy to share 50 key slides that support the gold bulls’ undying investment case. 46 of those slides include charts making connections to money supply, emerging market demand, U.S. presidents, and many other things.
On Physical Gold Supply Tightness
If the physical gold market is anywhere near as tight as these two market observers indicate, get ready for some serious fireworks in the precious metals markets. The first video is one that has been making the rounds in recent days. It’s an interview with Mihir Dange, co-founder of commodity trading firm Grafite Capital from the NYMEX, in which he discusses Chinese demand, backwardation and physical supply tightness.
The second video is an interview of Tarek El Mdaka, managing director at Kaloti Jewellery Group in Dubai. While it starts off slow, bear with it, as toward the end he states: “After this drop [in price] we have 90 days order logbook. So we cannot fill the demand we have at this stage.
Consumer demand for gold up 53% in Q2 2013
The latest World Gold Council Gold Demand Trends report, which covers the period April-June 2013, highlights how recent falls in the gold price have generated significant increases in demand, most notably from consumers in China and India – by far the biggest markets for gold – compared with the same time last year.
The key findings of the report are as follows:
- Consumer demand in China continued to show strong growth, totalling 276t in the second quarter, a rise of 87% compared to the same quarter last year, as investors used the lower gold price to buy in advance of expected future price rises. Jewellery demand in the quarter was 153t, up 54% on the same quarter last year, while bar and coin investment was 123t, up 157% on Q2 2012.
- Consumers in India also showed continued strong appetite for gold, with recent government measures to curb demand having had little impact on the quarter’s figures. Consumer demand was 310t, up 71% on last year. Bar and coin investment rose 116%, while jewellery demand rose by 51%.
- Bar and coin investment globally totalled 508t, a record figure, and a rise of 78% on the same quarter last year.
- Central banks remained committed to gold. Although demand of 71t in Q2 2013 was below the record quarterly figure of 165t purchased the previous year, central banks have now been purchasers of gold for ten consecutive quarters.
- There was a net outflow of 402t from ETFs in the quarter. This was more than counterbalanced by inflows into other forms of investment, such as the record 508t in bars and coins.
See Full Report World Gold Council Q2 Demand Trends
And some Technical Analysis
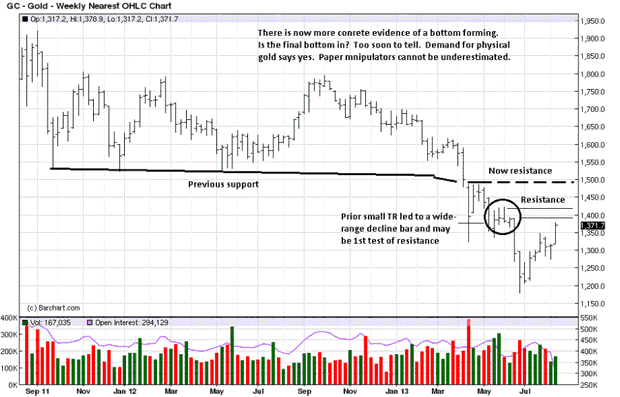
Gold is now beginning to show signs of a potential bottom. It is too soon to know for certain, at least on the monthly, [not shown], and weekly charts. Absent a surprise “V-Bottom,” when price rallies like a sling-shot from the lows, it takes time for a bottom to develop, so one is not being declared, as such. Instead, the weekly chart is used for context, while the daily and intra day charts are more for timing.
The 1500 area is important resistance, as noted. The circled small Trading Range, TR, led to a wide-range decline bar, and the high of that bar, along with the highs of the bars in the TR, forms a near-term potential resistance which is close to being tested. How price reacts to that area will provide important market information. For example, if ranges narrow on a decline in volume, that information alerts us to likely resistance. If the ranges are wide and volume strong, the resistance should give way.

Now, a daily chart with greater detail. This is the first time since price entered the 18 month TR, after the 2011 highs, that we can say the daily trend is up. It may be short-lived, it may continue higher, we do not know how the next several days/weeks will develop, but we can say for certain, at least for now, there are reasons to trade from the long side.


