Gold and Mining – Trapped Investors? (Update)
April, 26 2013Let’s take a broad look at the current (04.22.2013) technicals, so that we have some context for making decisions.
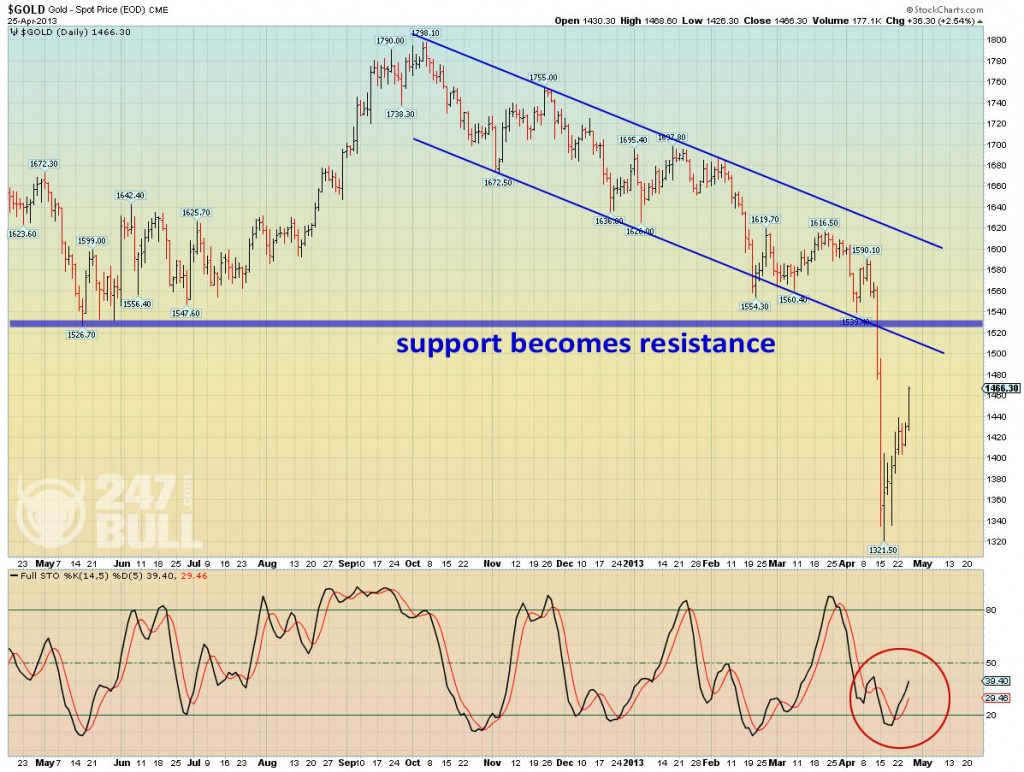
The daily chart shows the critical break below long-term support at about 1540. The bounce off the low is unlikely to be the beginning of a new rally, rather we think it is a short-term consolidation, like a reverse flag or pennant.
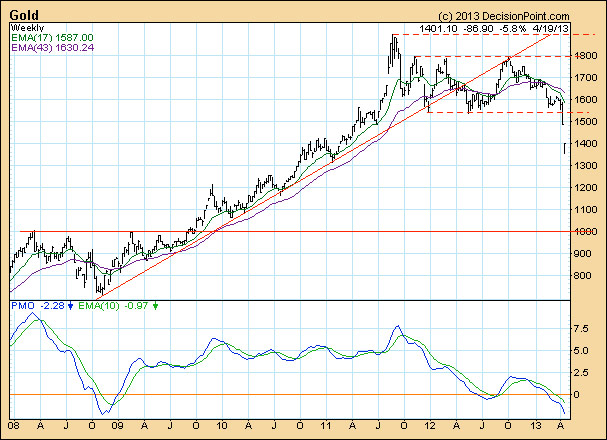
The weekly chart gives the best view of the trading range that has kept prices contained for over a year and a half. We thought that this was a price consolidation that would eventually lead to higher prices, so the failure of support was disappointing and has very negative long-term significance.
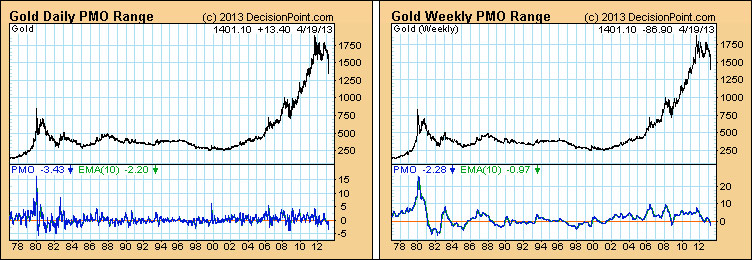
On the charts above you will notice that both the daily and weekly PMOs (Price Momentum Oscillators) are at the oversold side of the range shown on the charts, but a longer-term view below shows that neither PMO is challenging historical lows.
but a longer-term view below shows that neither PMO is challenging historical lows.
It’s a mad world out there right now…
Kyle Bass: Confused why Gold is so Low
Gold prices have plunged off the $1,600-per-ounce cliff and need to find support at about $1,560 in order to halt the massive downtrend in gold prices since last October.
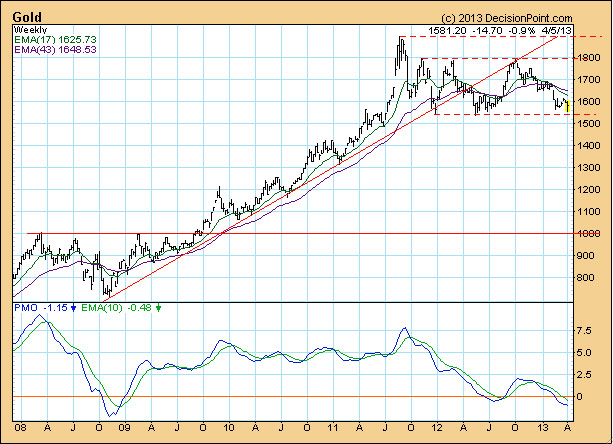
A quick look at the weekly gold chart shows that the metal is holding above a line of support that goes back over a year. Metal held and rebounded from its support identified at 1540. Gold prices have climbed to the top of the trading range at about $1,800 per ounce before falling back to about $1,540-1,560 per ounce. This level has proven to be strong support for prices in the past two years, and I expect that support to hold this time around, too.
Gold Mining Stocks Still Negative
While gold is still maintaining a long-term consolidation, gold mining stocks have signalled still lower prices to come.
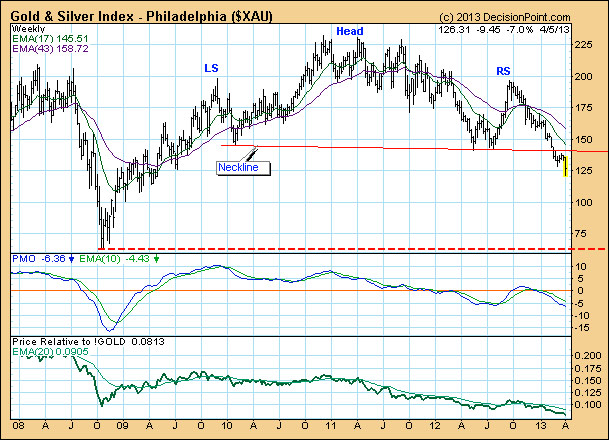
In contrast, the XAU (gold mining stocks) has formed a bearish head and shoulders pattern, which executed when price dropped below the neckline earlier this year. See previous post. We can see that the breakdown was followed by a brief snapback before the decline continued. At this point the minimum downside target would be the support line drawn from the October 2008 low.
It would be useful to note how dissimilar the two price lines are. One would think that the stocks would be closely related to the metal, but the charts will quickly clear up that misconception. (Prices are intraday.)
Premium Reco
While for the time being gold has bounced off long-term support, the XAU has signalled that there are still lower prices ahead for gold mining stocks.
For our gold holdings, that means we’re looking for a bump higher over the next month. Hold Sprott Physical Gold Trust ETV (NYSE:PHYS) and Gran Colombia Gold Corp. (Toronto:GCM).
On March 27, Central Asia Metals announced its full-year results for 2012. The company has no material debt and generated a $15 million profit, versus the $6.1 million loss for 2011. And it’s ramping up its copper productions with good expectations for 2013.


