

Finding the Market Bottom
June, 26 2022
Has the stock market hit bottom? Have stocks found support? When will prices stop falling?
Stock traders ask these questions every day, but they keep the wrong attitude to find the answers.

Trying to pick a bottom is like picking the winning numbers for the Lottery. You will only know if you are right AFTER the numbers are chosen. In other words, market bottoms can only be truly known until after they have occurred.
Fortunately for us, some clues and chart structures could lead to bottoming formations. We present you a short review of the main situations.
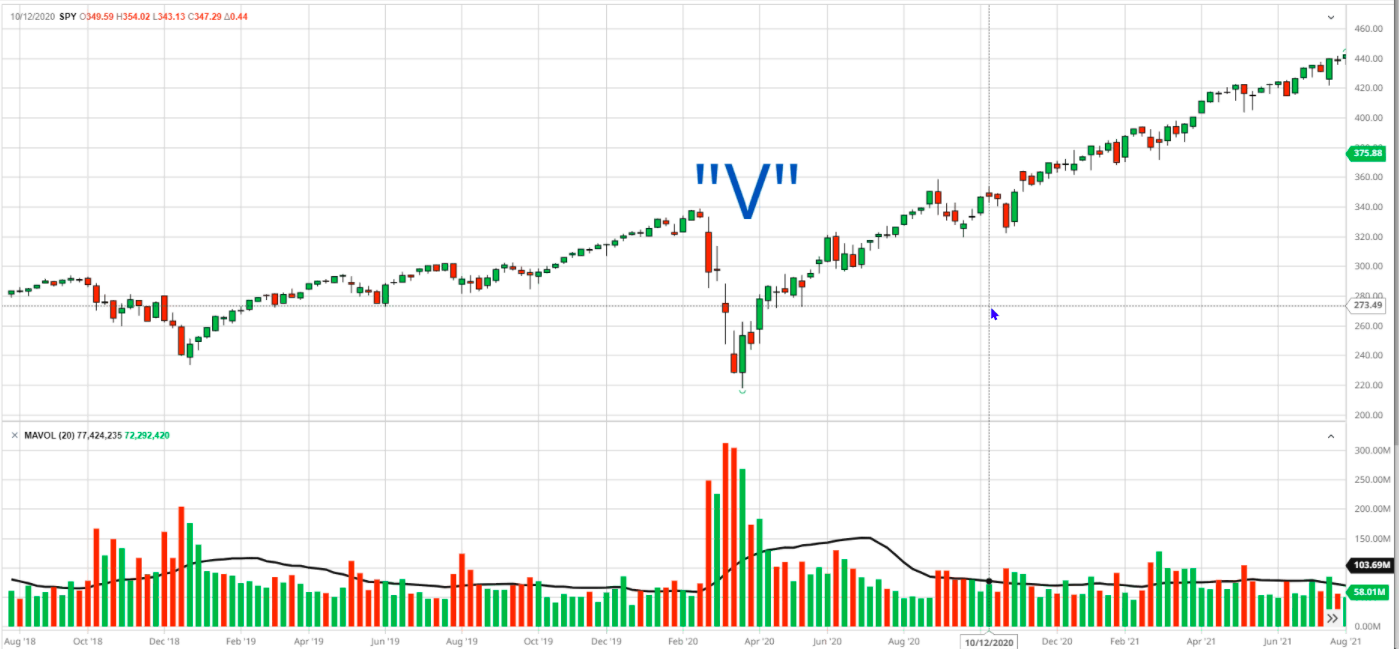
The “V” Bottom
Is characterized by a rapid decline in prices over a short “period” followed by a rapid ascent similar in “period.” This event-driven sell- off, or “capitulation”, is defined by a climactic spike in volume.
- The swiftest and shortest in duration, the “V” bottom is the easiest pattern to recognize but most difficult to predict.
- A spike in volume followed by higher than average but possibly declining volume are the first indication of the bottoming action.
- These bottoms are the most profitable because they can represent the first leg of a new uptrend.
- The bottom can’t be confirmed until price recaptures the origin of the rapid price decline.
- Candlestick reversal patterns like Engulfing, Bullish Piercing, and Three White Soldiers can help identify the rapid rebound.
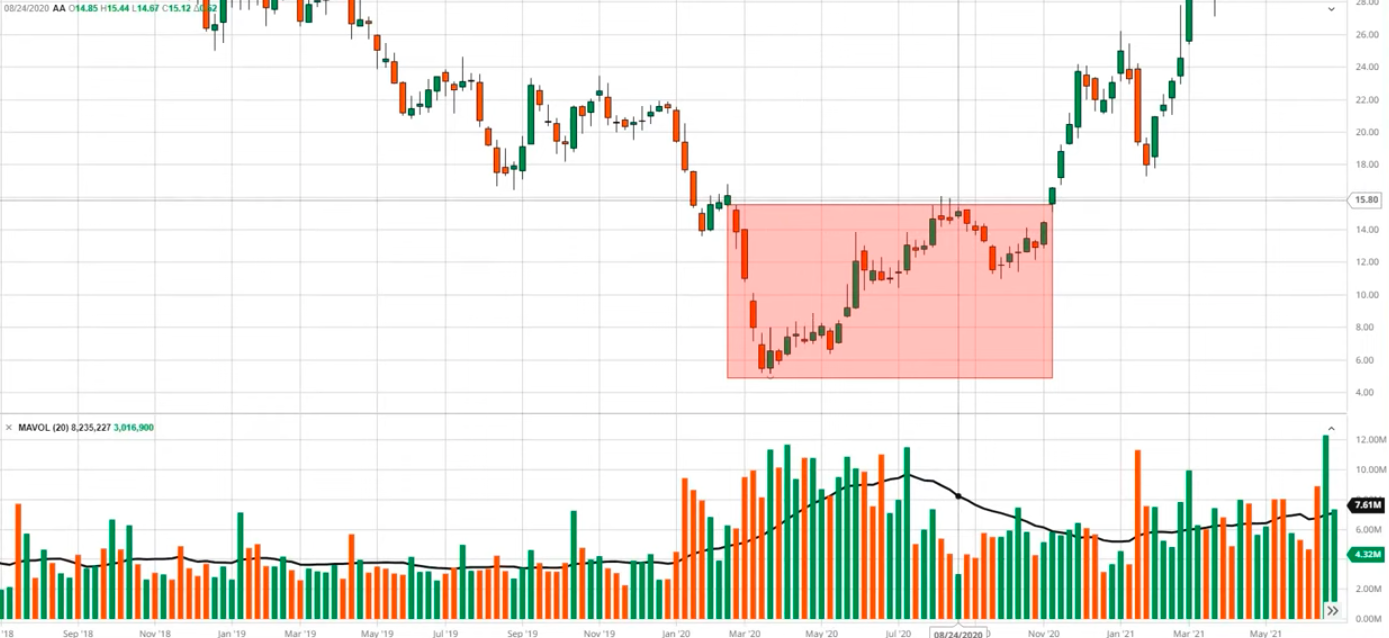
Typical example is the March 2020 Covid downtrend. Looking at the S&P 500
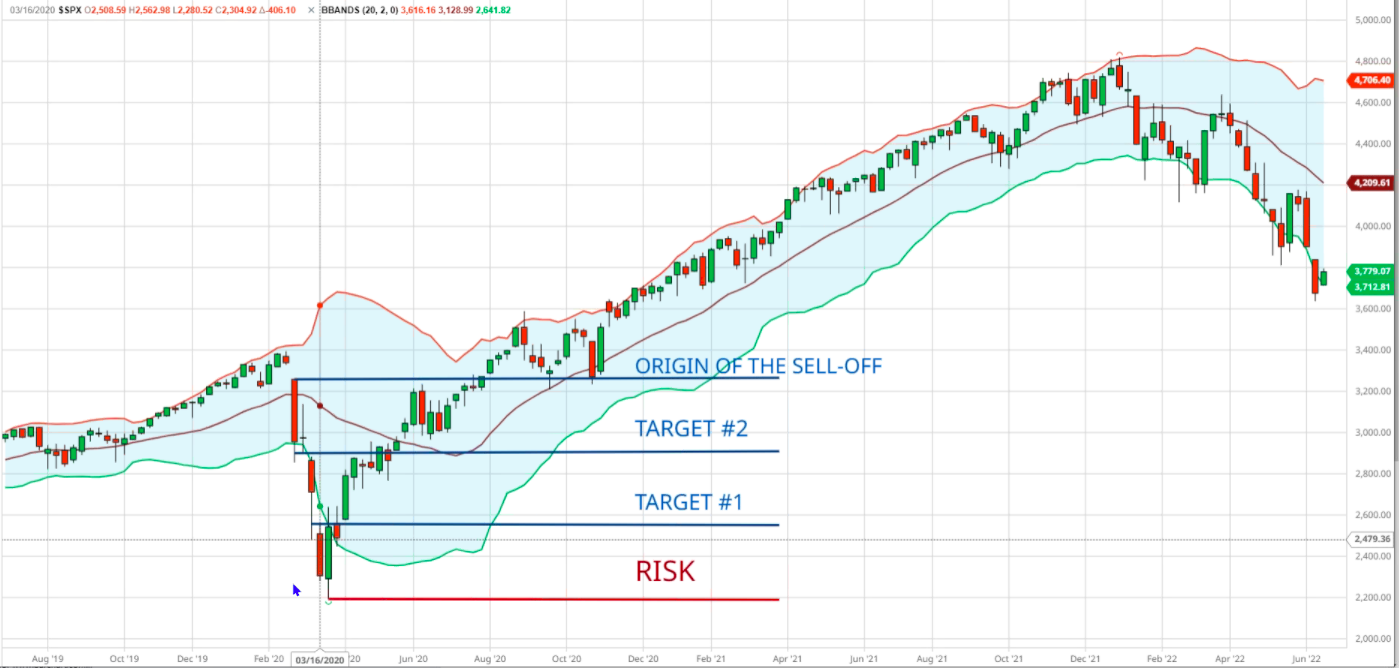
Once we have a possible reversal signal we an define the risk = previous low and set targets for the next moves.
Don’t forget that the downtrend is only over the market recaptured the origin of the sell off.
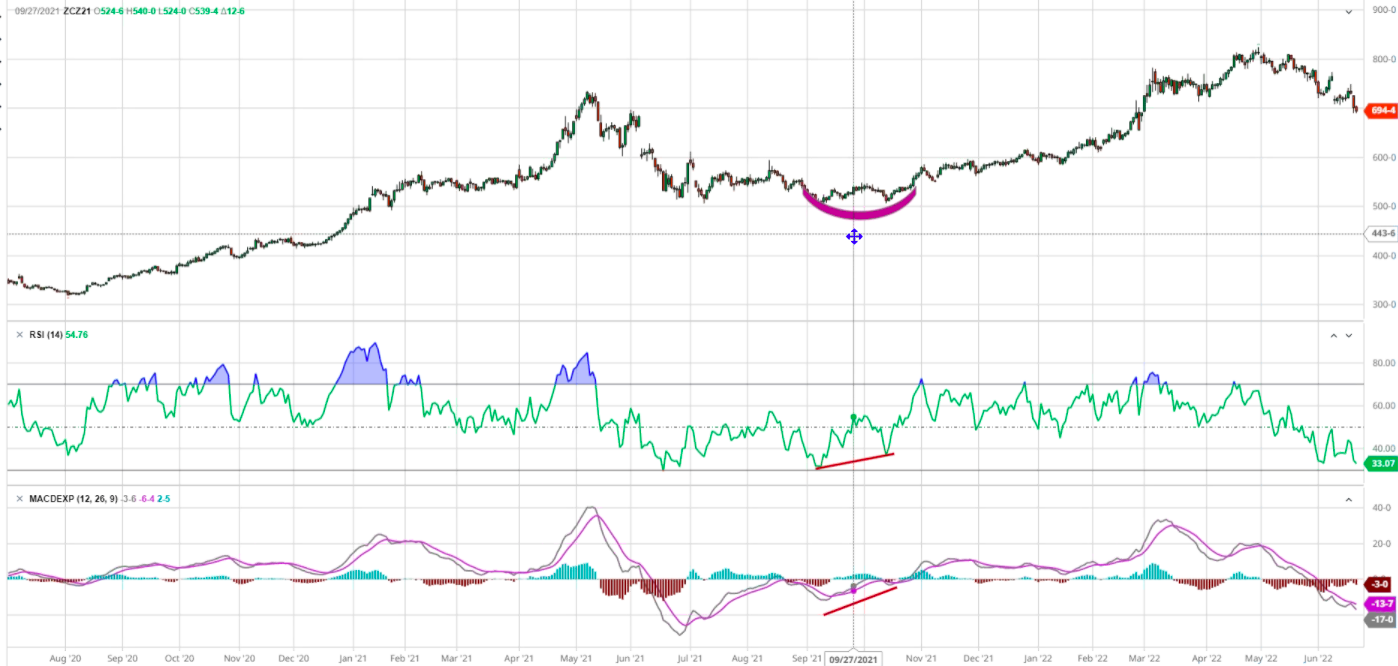
The “U” Bottom
Is more commonly found with individual equites and sector ETFs than the broader market indexes and comes after an extended downtrend where price typically re-tests the newly established low and is slow to recover positive price momentum.
- The “U” bottom can be preceded by both high and low volume, but rarely spike volume.
- Double bottoms, “W”, and inverted Head & Shoulders patterns are common with the rounding bottom process.
- Typically, the rounding process is defined by higher lows, but not necessarily higher highs.
- Momentum oscillators like RSI and MACD positive divergence can confirm the bottoming action.
- The Cup & Handle would be an excellent example of a “U” bottom.
Here we see how a positive momentum is developing as we have a positive divergence in our indicators
On the next chart we can see the developing bottom swith higher lows but not necessarily higher highs in a W bottom. Notice also that the volume reamins low.
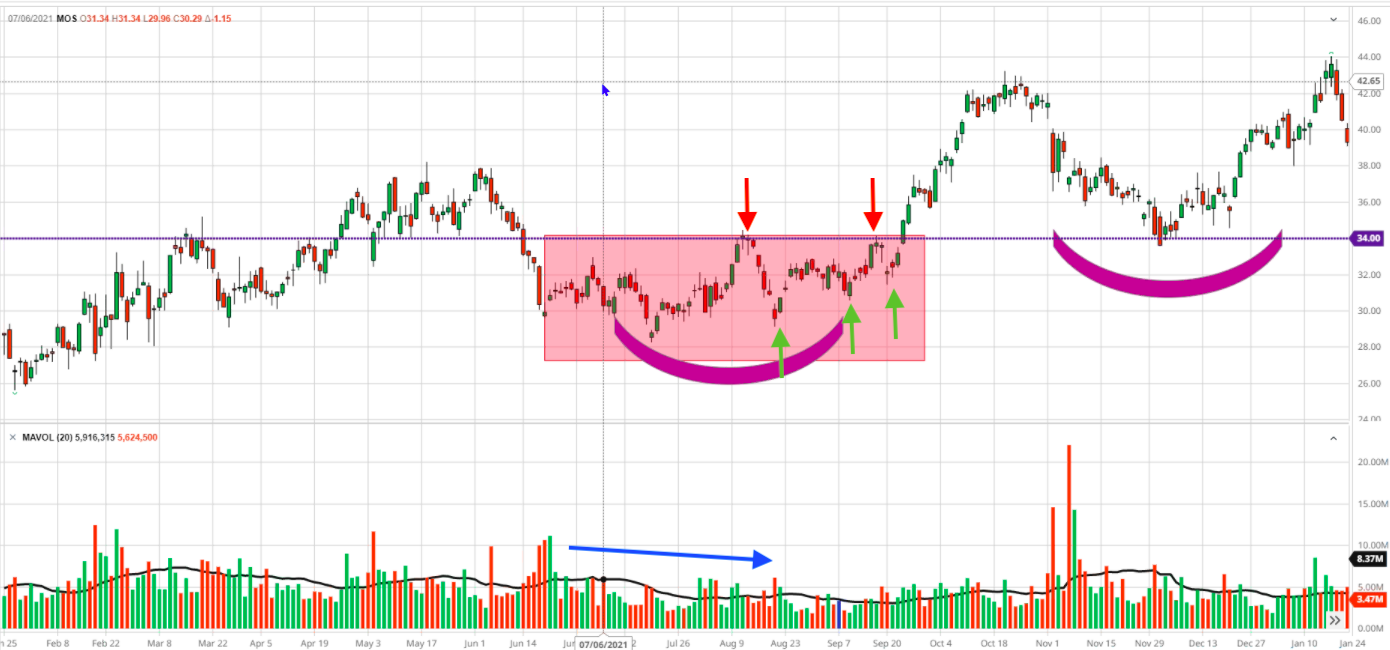
Cup and Handle example
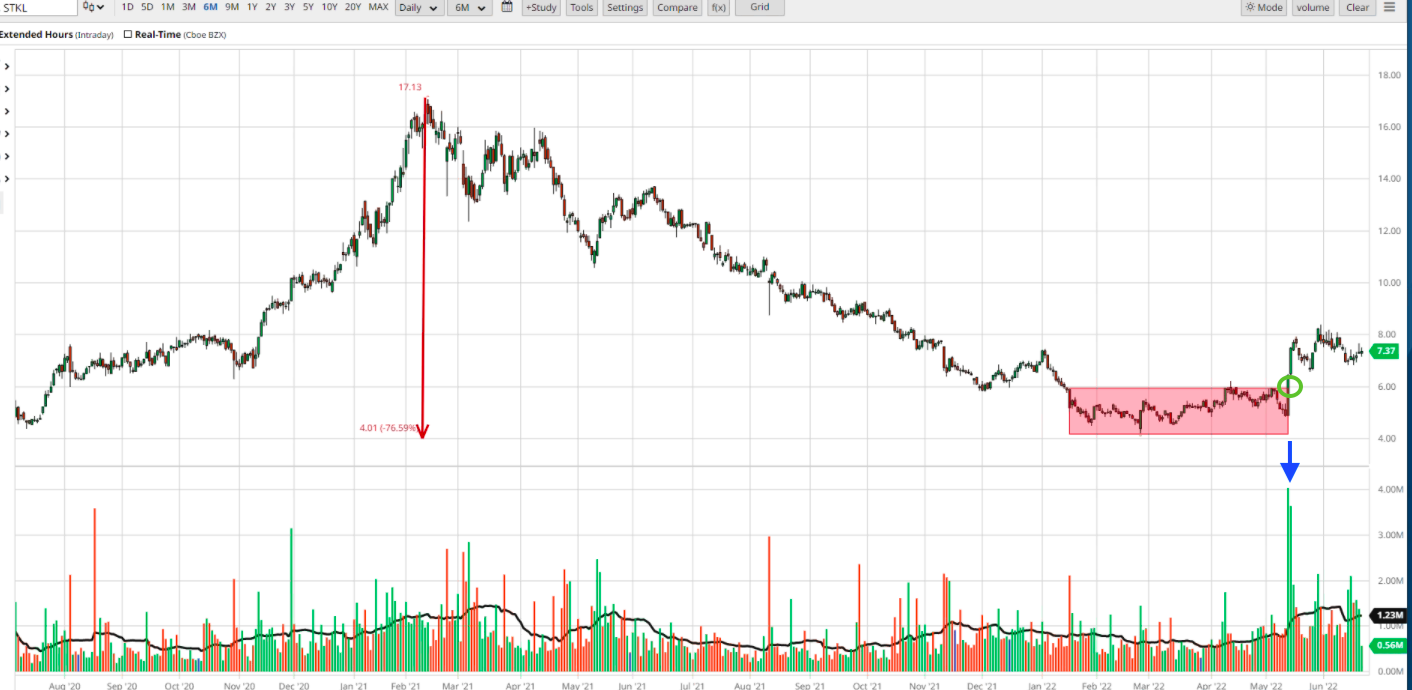
The “L” Bottom
More common among out of favor stocks and sector ETFs. This bottoming formation is the longest of the three and is distinguished by low volume and lackluster price movement.
- Found after a long downtrend of considerable price decline.
- The chart pattern looks like the letter “L” laid on its side.
- After the low has been established a low volume range-bound price action can be represented by a “box or rectangle” formation.
- “Mean reversion” strategies work well during the range-bound action.
- Trend following systems would benefit from a filtering process to alert of a potential breakout.
- ATR, Bollinger and Keltner Bands, and Turtle channels would be good examples of breakout filters.
Current Market
Is this low a tradable bottom or the beginning of a new uptrend?
Has price recaptured critical levels of resistance?
Is there a catalyst behind the upward price momentum? VOLUME
Have macro market conditions changed ?
- The Feds monetary policy starts to influence demand and inflation.
- Easing in the appreciation of the USD.
- Bonds always lead Equities.
- The return of the “Retail” investor.
- Risk “ON” environment
- Increase in Call buying
- Lower P/C ratio
- Positive news to break the bearish sentiment.
- Resolution of the Ukraine conflict
- Passing of the Safe Banking Act
- Decrease in the price at the pump
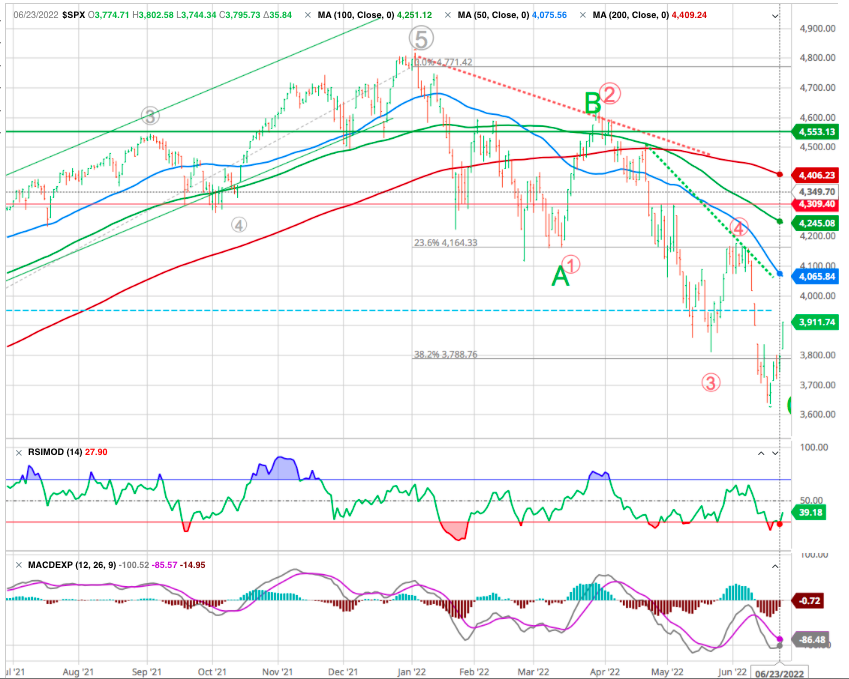
So Yes it was a tradable bottom but things are moving fast, there is still some room upward. But is this the bottom? probably not, retest would have to be done and we do not have spike in volumes.
How long could this bear market last?
The average bear market in history has lasted for 13 months. That is measured from peak to valley. So in this case the peak of 4,818 was set on January 4, 2022. So if things went according to schedule we would say bottom is likely to be found around February 2023.
However the stock market rarely does anything according to schedule leading to the next question…
Will this bear market be longer or shorter than the 13 month average?
We think it will be shorter because everything about the modern market works faster. Meaning that with so much computer based trading, volatility has increased with stocks rising and falling faster than ever before.
So quite possibly we find bottom faster this time around as well.
Our scenario
Markets are really alternating between fear of recession and fear of inflation. So, we are seeing alternative bouts and today clearly recession has taken over. It is in the global markets and not so much to do with local markets. It is flow linked and sentiment linked. Valuations have been contracting right now and the next leg down starts after this quarter’s earnings come through and management guidance starts.
The next leg down will come as earnings start to contract as the margins come under pressure or the top lines get clouded by a recession fear of next year. We are probably three to six months away from finding a durable bottom for this market.
One big factor is the US mid-term election year. Normally, the markets tend to bottom out around August-September and we see a good rally going into the year end in the mid-term years for the US markets and that should help us. What will really work out for us is to wait for July-August and let the central bank actions happen.
Let us wait that out and hopefully by September-October, we will start seeing these markets bottom out. The good part will be if the supply chain issues start getting worked out and we see lesser demand with the higher rates and the Fed does not need to go through with its entire rate hike programme, that would be good and that could rally the markets October onwards.
Right now, 80% of central banks around the world are hiking rates and withdrawing liquidity. That kind of environment is not good for equities. Where will it bottom? We do not think we have come anywhere near the peak for interest rates, inflation or dollar but we are probably at 75% to 80%. In a month or two, we might reach peak inflation for this cycle. Dollar hit 105 plus and came back down. It is strong. Maybe it has hit its peak and then peak interest rates will be very critical. Once we see .. that the Fed is done and we are near 3%, the whole market complexion might change.
At this point, we could only recommend a hold on the S&P 500 and selet blue chips (see our ABS Matrix) for tactical and long term positioning. The liquidity shock risk is very high and it will likely last until we get some positive data on inflation, which will provide the Fed with support to pause in September.
In other words, we need to get the solid evidence that the Fed is able to implement a soft landing.
Takeaways
- Bottoms can only be truly known after the fact.
- Patience and Discipline are the keys to trading bottoms.
- Spike volume is a valuable tool in determining “V” bottoms.
- High volume as price rallies is the greater confidence indicator.
- Momentum oscillators like RSI and MACD are excellent indicators for confirming price action.
- Candlestick reversal patterns at both lower and higher time frames can confirm the bottoming process.
Conclusion
You need to look at other indicators to determine when the stock market is going to find a bottom and start moving higher if you don’t want to miss the initial surge.
While no indicator is a magic bullet for identifying a market bottom, monitoring a few broad economic indicators can give you a good idea of how healthy the global economy and the stock market are.
After all, stocks go up when the companies represented by those stocks do well, and companies tend to do well when the global economy is healthy and functioning correctly.
Let’s review a real case :
Winning at poker or at investing requires reading the “tells.”
A tell in poker is a change in a player’s behavior or demeanor that is claimed by some to give clues to that player’s assessment of their hand. A player gains an advantage if they observe and understand the meaning of another player’s tell, particularly if the tell is unconscious and reliable.
In stock markets the tells are not all the same and often come in different shapes and forms. But if you watch for a bunch of them, you can improve your odds of detecting the right one. We are of course referring to a “tell” that lets us know the bottom is in or very close. Let us give you an example of one such tell that works quite frequently.
In August 1979 the infamous BusinessWeek cover story, “The Death of Equities: How Inflation is Destroying the Stock Market,” predicted that inflationary problems would never go away.
In April 2019 cover story told investors that inflation would never return.
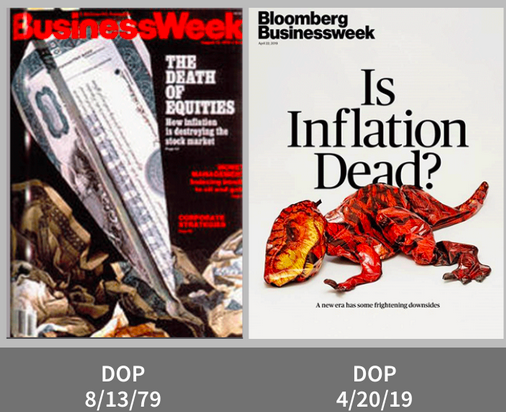
The message was simple: after declining for 40 years, inflation was about to return with a vengeance.
Another example
March 2009. The world appeared to be falling apart. Wall Street Journal was calling for another 30% down move in the Dow.
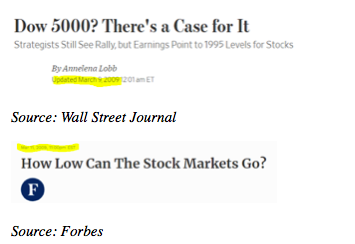
But something curious happened as indices made new lows in March 2009.
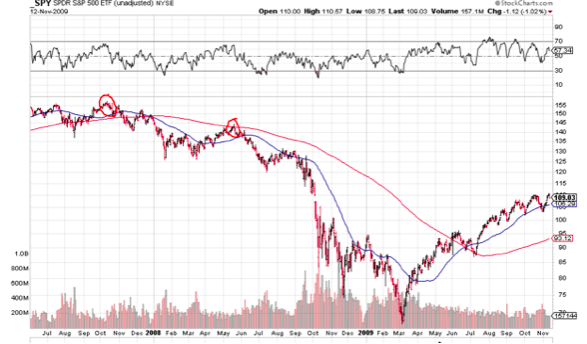
Fewer and fewer stocks actually hit new lows. The New Highs-New Lows Index had hit its nadir in October 2008 and each successive low saw the index refuse to make a lower low.
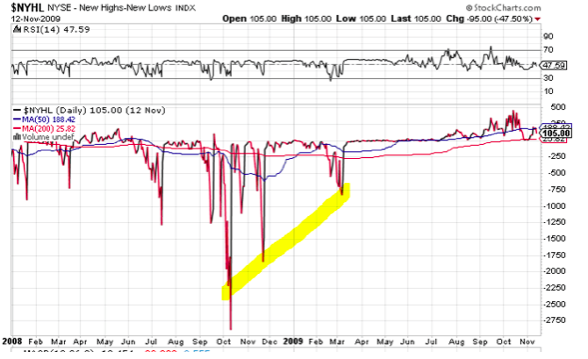
This may seem counter intuitive but the reason this happens is that the index moves based on stocks with the highest weights. Those tend to get sold at the last part of the bear markets. Additionally, the fund managers often rotate from the heavy index weights to stocks that have much higher rebound potential.
In 2002 we saw a similar albeit less obvious divergence.
The lows in July and October 2002 and March 2003 were almost exactly at the same spot (unlike the progressively lower ones in 2008-2009).
Until next time !