

MARKETSCOPE : As Goes January…So Goes The Year?
February, 07 2022

Last month, we wrote to you about the so-called January Barometer. This seasonal tendency for the stock market to either rise or fall in the first month of the year has an uncanny ability to predict stock returns for the rest of the year. And as you probably know by now, this year’s January Barometer results are not good news for stocks in 2022. >>. check the January Barometer here
Bottom line is, when stocks drop in January (typically a positive month), watch out. We should all be prepared for both lower stock returns and higher volatility this year. And that has been the main theme of our latest commentaries. We shall keep you posted.
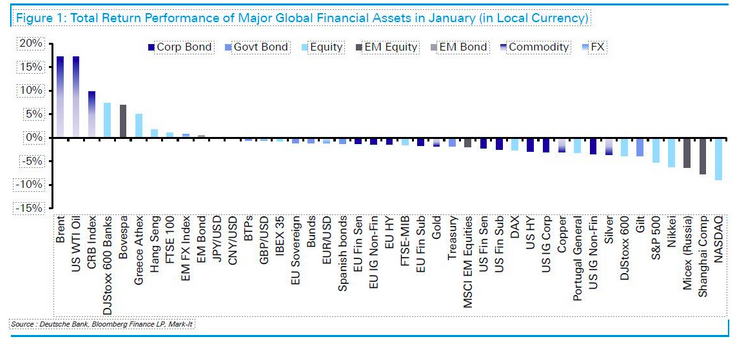
The above Deutsche Bank chart shows how poorly January was.
Oil: After its impressive gains in 2021, oil held onto its position as the top-performing major asset in January as well. Oil markets are on their seventh consecutive week of increase and are now up by more than 15% since January 1, 2022.
US Dollar: The dollar was the strongest performer out of the G10 currencies in January, with the dollar index hitting an 18-month high thanks to a further +0.9% gain.
Credit: It was a bad month across the board in credit as well, with January marking the first time since March 2020 that every credit index in our table moved lower.
Sovereign Bonds: As with credit, sovereign bonds lost ground across the board, and US Treasuries (-1.9%) underperformed their European counterparts such as bunds (-1.1%) and OATs (-1.2%). Indeed, it was the worst monthly performance for US Treasuries since February 2021.
Cryptocurrencies: It was a bad month to be in cryptocurrencies as the selloff from late-2021 continued. Bitcoin ended the month down a further -17.0.
 Following the monthly US jobs report, Non-farm Payrolls jumped massively relative to Wall Street expectations, with upward revisions of similar (or larger) magnitudes to the December and November numbers jumped to +467K, far above estimates of 125-150K, the Fed is widely expected to increase interest rates in March, probably foreshadowing continued high volatility in the coming weeks.
 Christine Lagarde is following the general trend set by the Fed, at least when it comes to the ambiguity of her speech. She hawkishly noted that “risk to inflation outlook are tilted to the upside”.
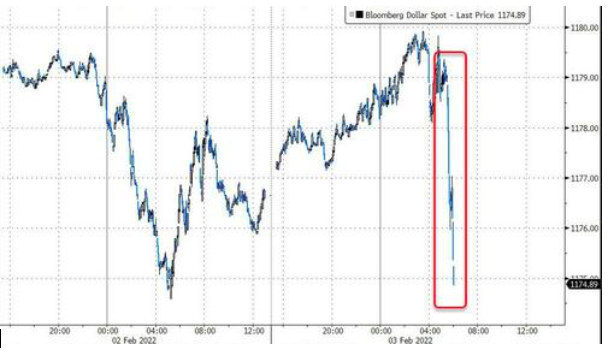
The ECB is no longer ruling out the idea of raising rates this year, whereas this was taboo until recently. -see below- European inflation (5.1%) is certainly lower than in the US, but it is not under control.
The euro has logically taken the upward slope, up to 1.1470 USD currently. The same is true of the Swiss franc, at CHF 1.0569.
The end result is that EU money markets are now pricing in a 10bps rate-hike by the ECB in June, and a 20bps hike in September.
On the government bond side, the 10-year US government bond is yielding 1.91% (vs. 1.84% last week), and the Bund is now at 0.20% (vs. -0.02% a week ago).
In the meantime, things are shaky on Wall Street. With the market rally, the previously oversold indicators are reversing, and buy signals are heading higher. The markets do look to be stabilizing.
Fear is in the Air
Week January 31 to February 4

We are now in “no man’s land.” In other words, with earnings season still in play, we could see the markets push higher. We could also see a retest of recent lows. The problem with making any “major allocation” call is dangerous of being on the wrong side of the trade. Just look at the reactions following the publication of earnings reports of tech giants like Meta (-26%), Paypal (-25%) or Netflix last week (-22%).
Conversely, Alphabet and Amazon surprised on the upside and are rewarded by the market (respectively +8% and +11%). A market that does not know what foot to dance on, oscillating with great volatility between extreme panic and an equally disturbing euphoria.
Although this near-correction may have seemed sudden, in reality it’s been a rational adjustment to the changing interest-rate outlook.
Valuations such as price-earnings (P/E) ratios have already come down significantly since the market’s early-January peak.
While valuations may have further to fall, the remainder of the compression may happen gradually via earnings growth (instead of suddenly via further price declines).
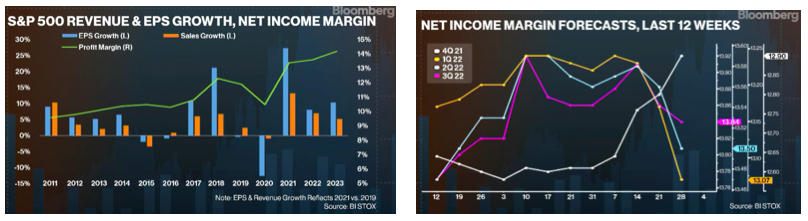
Savita Subramanian, quantitative strategist at Bank of America Corp., shows that the underlying trend in both earnings and sales announcements is that investors have caught up with the reality of post-pandemic earnings growth. After four successive quarters in which forecasts were being almost constantly upgraded (and providing some great fuel for the overall market in the process), markets are no longer needing to make up lost ground. The great catch-up trade of 2021 is over.
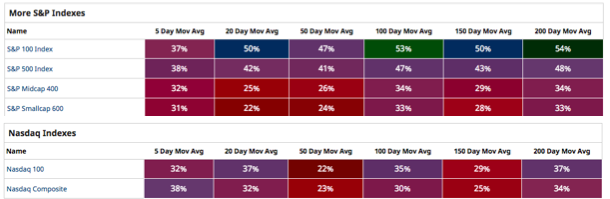
With the market now in a broad-based decline, stocks might look dangerously weeak as shown by the percentage of stocks trading above their 50-day moving average is now at its lowest level since March 2020 :
Still Extreme Levels Of ‘Ridiculousness’
Let’s focus on the Nasdaq, given the extreme weighting of just a handful of companies in the index.
Despite the strong two-day rally to finish the month, January was the worst start to the year for the Nasdaq (down 19% peak to trough) since 2008.
And if not for that two-day rally, it would have been the worst start for the Nasdaq ever – and ever, as they say, is a very long time. As a result, you might have thought that the decline would have made some progress in normalizing valuations but you would have been wrong. The median stock in the S&P 500 Index is still roughly 20% more expensive than it was pre-pandemic and 70% more expensive than at the peak of the DotCom Mania in 2000.
After witnessing his own stock price plunge by more than 90%, Sun Microsystem’s Scott McNealy famously suggested this degree of overvaluation was “ridiculous.” By then, the number of stocks trading above this hurdle had fallen from a peak of almost 50 to about a dozen. So if we are now seeing another bust in the most speculative segments of the stock market, it would appear it still has quite a ways to go.
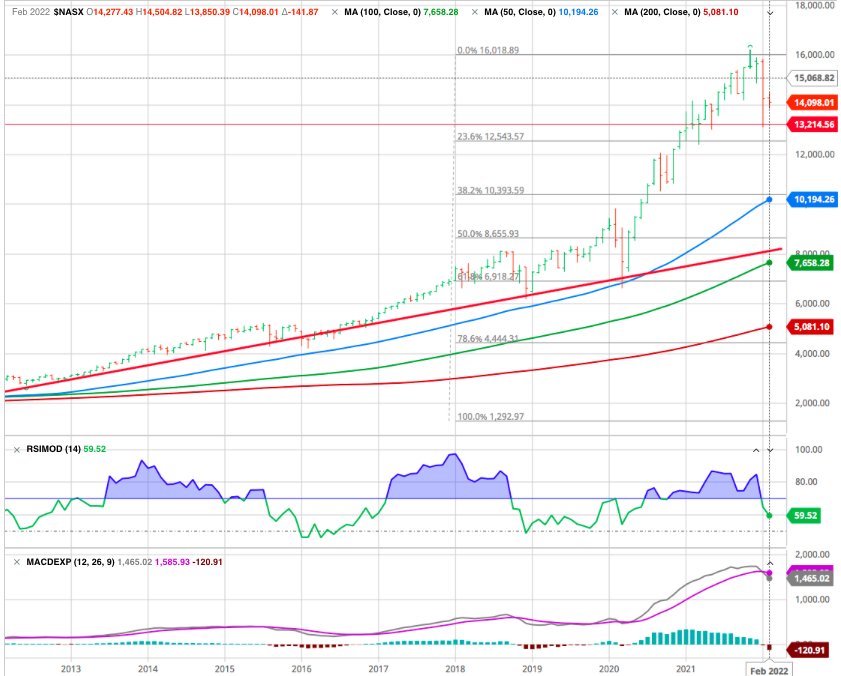
If the “growth” period of the market is over, then the Nasdaq has a substantial way to fall to complete a 50% correction from the 2009 lows. However, that correction would only return the Nasdaq to its previous bullish trend line (red). A 61.8% retracement would make it a “bear market” by breaking the bullish trend.
Gold
rose a bit this week to USD 1,810, but failed to spark a rally despite rising volatility in equity markets. The weekly rise had more to do with the fall in the greenback, which made the ounce of gold more attractive to “international” investors. Silver was flat at USD 22.5 per ounce.
Let’s have a look at the long-term relationship between the Euro currency and the price of Gold. And, as you can see, moves in the Euro tend to effect Gold (whether short-term or longer-term).
When the Euro peaked in 2008, it lead to a short-term Gold hiccup. And the Euro trading top (retest of highs) in 2011 also marked the top in Gold. The Euro bottomed in 2015-2017 along with Gold as well.
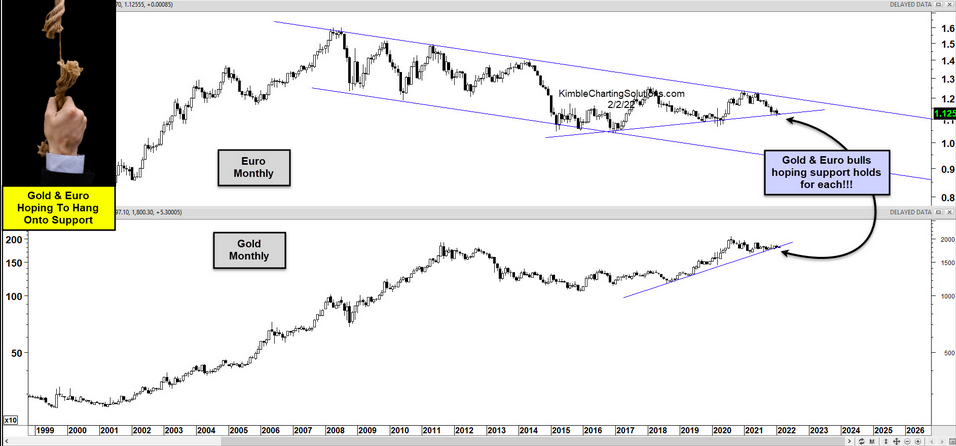
So, what’s going on right now? Well, both the Euro and the price of Gold have been in multi-year up-trends recently (see trend lines below). But those trend lines are being tested right now!
This is an important test of support. Gold and Euro bulls are hoping support holds here!
Crypto-currency market is still unable to extricate itself from the slump that began almost three months ago. In the wake of stock market indexes, bitcoin has yet to get its head above water. It finished above 41’000.
Picking up the pieces of the recent rotation
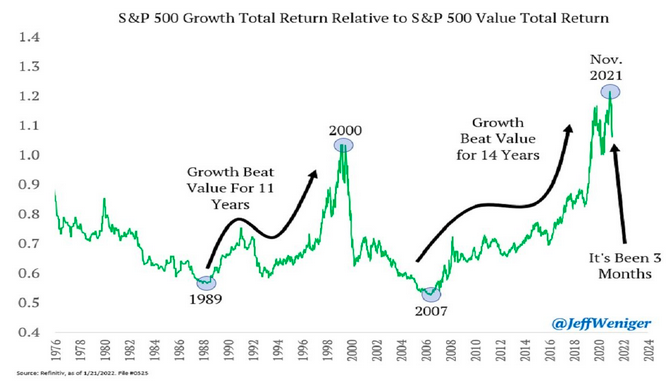
The powerful rotation markets have experienced these past weeks – in favour of value and at the expense of growth. speculation around more aggressive Fed monetary policy normalisation has resulted in US real rates edging higher, sparking outperformance of value stocks versus growth ones. Yet last week some stabilisation in real rates brought about a pause in this growth-to-value rotation, at least from a very-short term perspective.
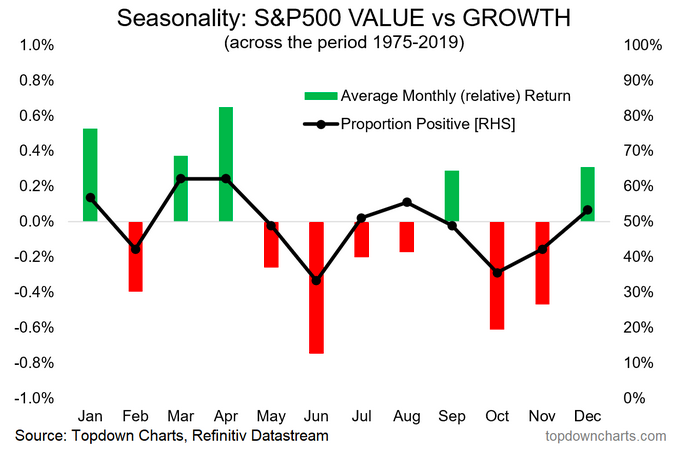
In our view a significant part of the rerating has been made over the last few weeks (the US 10Y yield is now already at 1.8%) making growth stocks less vulnerable to further rise. We still think value opportunity remains, but now on a more selective basis (and the more tactical might now find some growth opportunity among the wreckage).
A turning point is a process
Take a look at this chart (highlighted by John Authers from Bllomberg )in log scale :

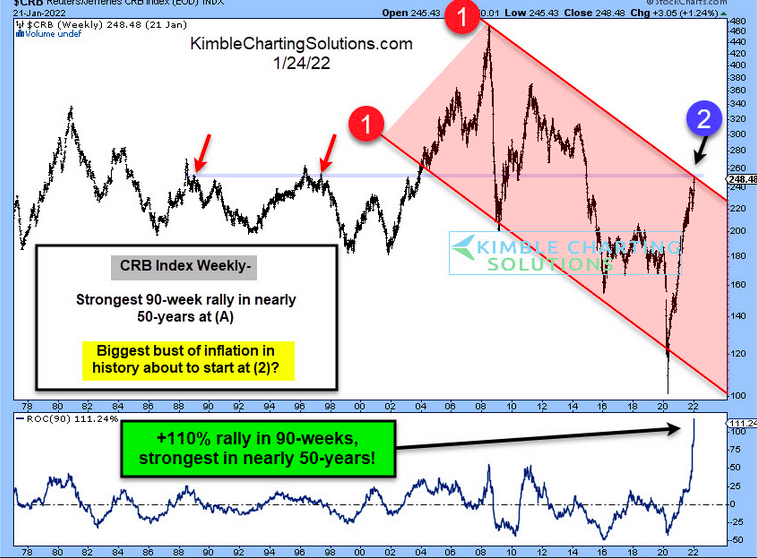
It shows history’s secular bull and bear markets for equities set against trends in the bond market and, crucially, commodities. Over time, commodity prices tend to move in long waves, a phenomenon often associated with the Soviet economist Nikolai Kondratiev. When commodity prices are in a falling wave, stock markets do very well, as they have for the last decade. When commodities are in an upward wave, stocks tend to move sideways for long periods of time. With oil prices at the highest since 2014, this again looks like evidence that we’re in the process of changing regimes.
CRB INDEX (1977-2022)
Happy trades