

MARKETSCOPE : Red October
October, 03 2022
October Starts Off Scary Well Before Halloween

For financial markets, it’s been a bad week, month, quarter and year. The most notable event was probably the Bank of England’s emergency decision to buy back British debt. The month of September once again lives up to its bad reputation on the stock market. Investors remain pessimistic amid soaring prices and hawkish monetary policies.
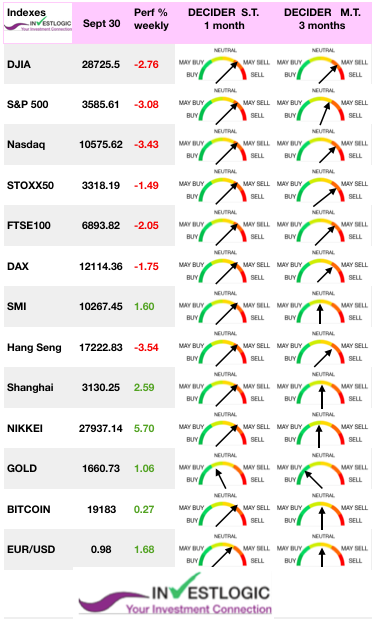 To put a finer point on the current market carnage, with investors still concerned about aggressive Federal Reserve policy, the S&P 500 just wrapped up its third straight quarter of losses, a perilous streak not seen since the 2008-2009 Great Financial Crisis. The S&P 500 was down 1.51% on Friday, closing out its worst month since March 2020. It fell 9.3% for the month, while the Nasdaq was crushed 10.5%. The Dow and S&P 500 touched new lows for 2022.
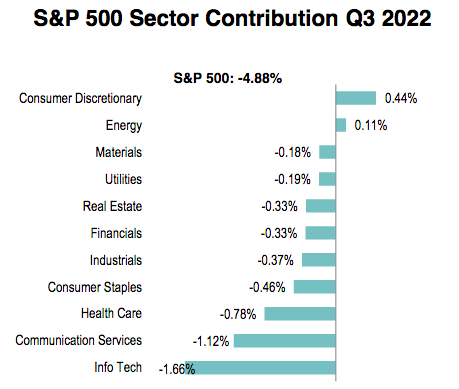
The Nasdaq remained just off its previous 2022 low of 10,565.84, set back in June. Still, this represented the lowest closing price for the Nasdaq since July 2020. Ten of the 11 S&P sectors finished in the red during the last session of the quarter.
In a signal to what to expect in Q4, Federal Reserve Vice Chair Lael Brainard signaled that the central bank was not planning to return to an accommodative stance in the near future.
The various headwinds continue to weigh heavily on equities. Investors would be in a much better state of mind if they didn’t have stocks in their portfolios! Some of what produced this disappointing outcome still hangs over markets, making it hard for investors with cash—and there is quite a bit of dry powder out there—to respond to increasingly attractive valuations
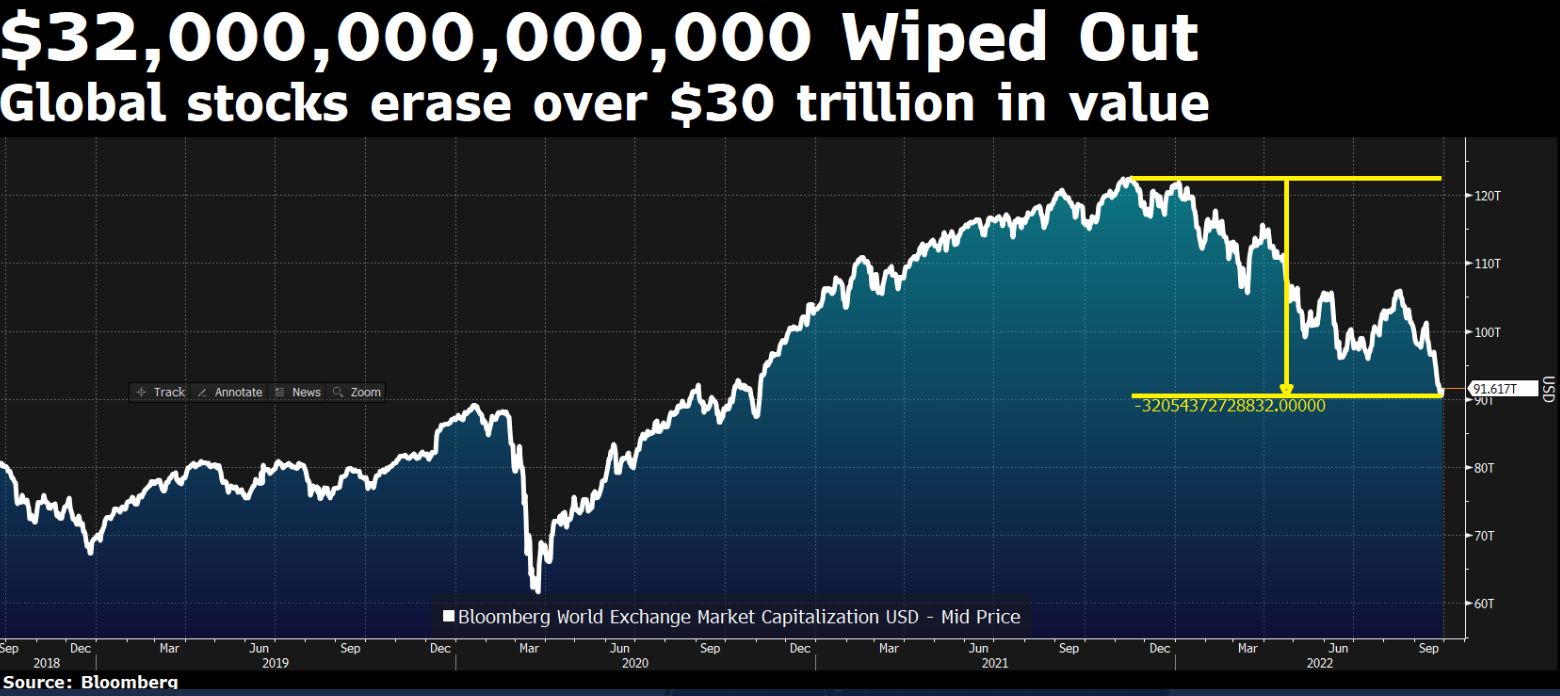
$32T in Wordwide Stock Market Value has been Wiped Out Since November 2021
In Europe, yields jumped at the start of the week amid worries about a severe deterioration in the public finances and then eased after the BoE said it would make temporary purchases of long-dated bonds “on whatever scale is necessary” in an effort to “restore orderly market conditions.” Shares in Europe fell slightly amid disappointing corporate earnings and fears of recession.
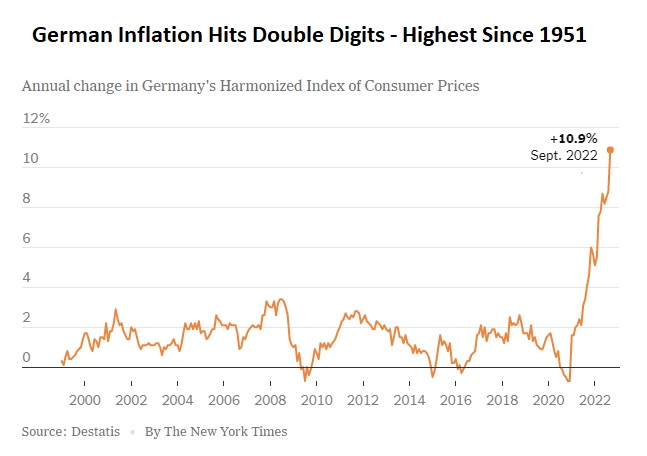
European inflation in September, which accelerated to 10%, shows that the battle is far from over. Meanwhile, Britain, the scene of conflicting policies between the Bank of England and the new government, is cause for concern.
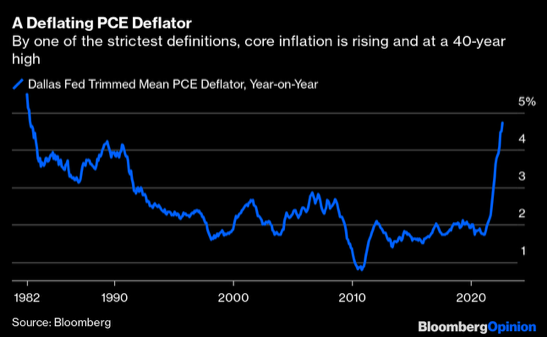
Trading took place amid PCE price data that rose more than forecasters expected. The core Personal Consumption Expenditures price index, widely recognized as the Fed’s preferred inflation gauge, rose at an annualized pace of 4.7% in the second quarter—well above expectations of around 4.4% as well as the Fed’s long-term 2.0% inflation target.
For a stripped version that statistical purists regard as probably the best measure of underlying core inflation, the Dallas Fed publishes a “trimmed mean” that excludes the biggest outliers in either direction and takes the average of the rest. Thus extreme moves such as last year’s inflation in used car prices are excluded. And on this basis, US inflation is at its highest in almost four decades
MARKETS : short-term reversals,
On Friday, the market took out the June lows but is testing support going back to the peaks in 2020. As noted, every technical indicator is now screaming oversold. We suspect that as we enter into October, we could see a more sustainable reflexive rally to roughly first resistance 3813 on the S&P 500. Investors should continue to use such rallies to raise cash and rebalance risk accordingly.
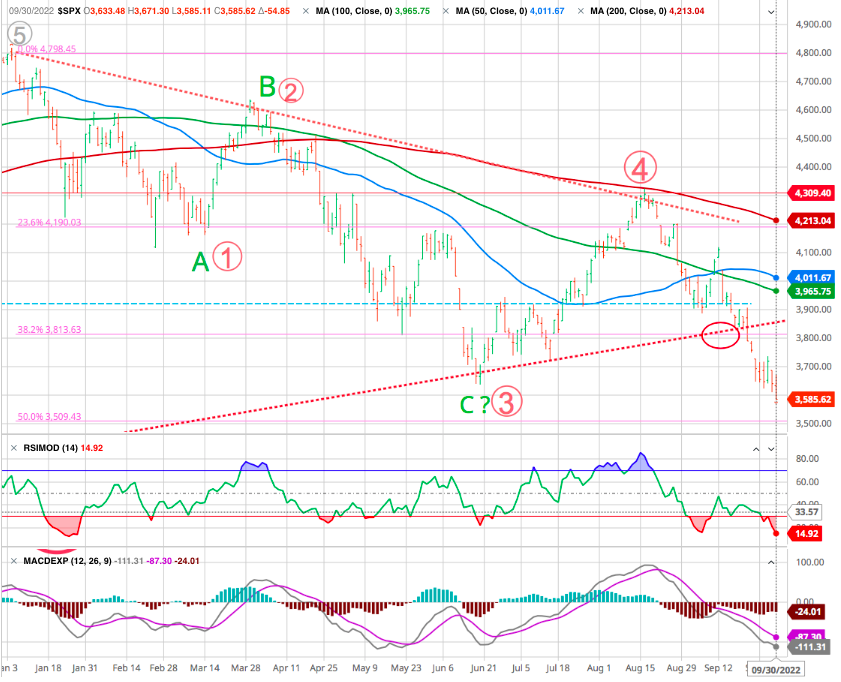
Initial support is in the 3585SPX region, also the Weekly MA-200 with support below that in the 3300SPX region. There is a pattern in place which can hold the 3550 support in the coming week. But, if we are unable to move back over the resistance, then we can certainly continue down to the secondary support region, a 61.8 % retracement at 3200.
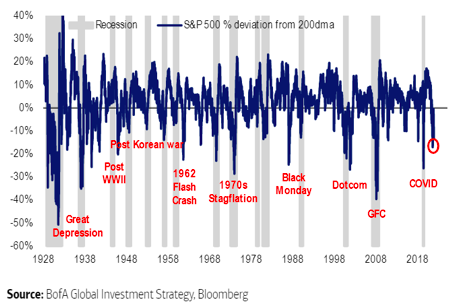
There’s much discussion of a possible bear market rally, and that seems reasonable. Compared to its own 200-day moving average, the S&P looks seriously oversold. This chart from Michael Hartnett of Bank of America Corp. shows that the market has come down so swiftly that at least a bounce seems very plausible:
Meanwhile the put to call ratio is at record high. It is noteworthy that retail investors and institutions are buying puts in record quantities and with record premiums. It is a typical contrarian indicator.
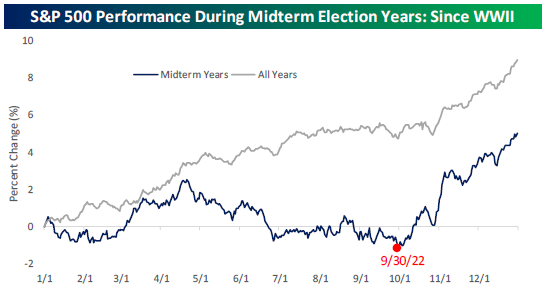
As noted by Bespoke Investment : It’s hard to find much good news out there right now, so we’ll leave you with at least one bright spot. Based on historical price action for the S&P during mid-term election years since WW2, today has historically been the absolute low point of the year:
A retracement to 3900-4000 on the S&P 500 index will be a suitable level to rebalance portfolio risks heading into next year.
Long-Term View Is Bearish
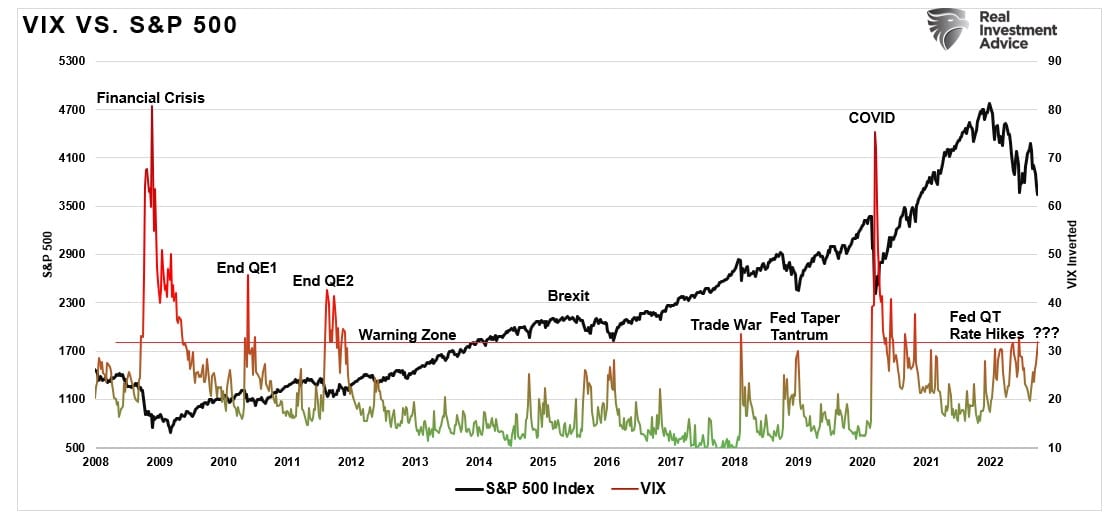
The risk of market instability is rising, as seen in the volatility spike this past week. While that volatility spike remains subdued, it has reached the warning zone, suggesting something may be near breaking in the markets.
Nvidia broke down below the June 2022 low and the 200 Week MA. Nvidia It reminds us of Cisco in 1999/200. Looking casually at the chart of Nvidia’s stock, one realizes that the downside risk for a large number of companies is still enormous.
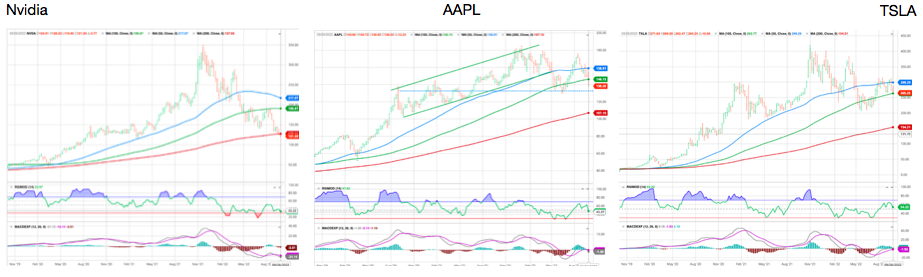
As an example, our sense is that the US stock market will not bottom out before Tesla and Apple break down decisively.
We also think that before asset markets bottom out, we will see somebody or something “BIG” go out of business -See below Credit Suisse turmoil- and the revelation somewhere of a massive fraud, which would badly shake confidence.
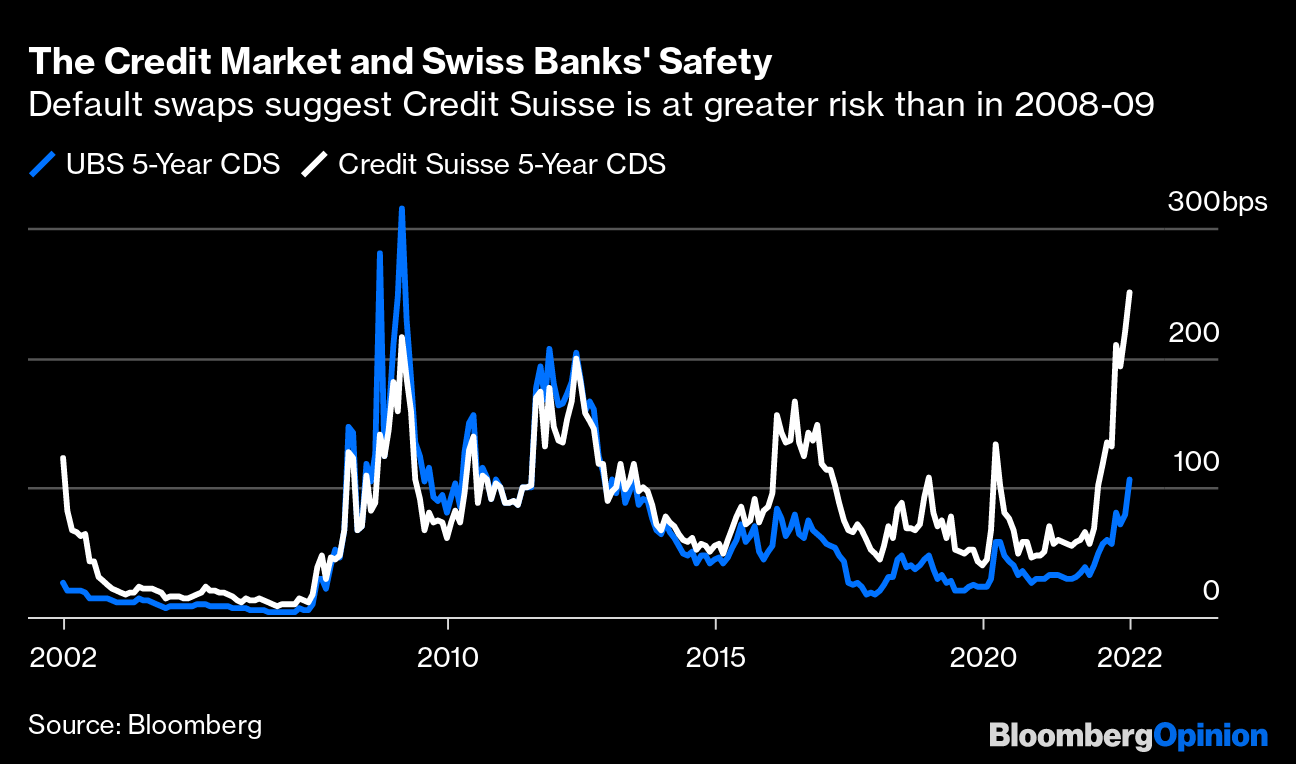
CREDIT SUISSE : To Set the Sails
20 years of CS
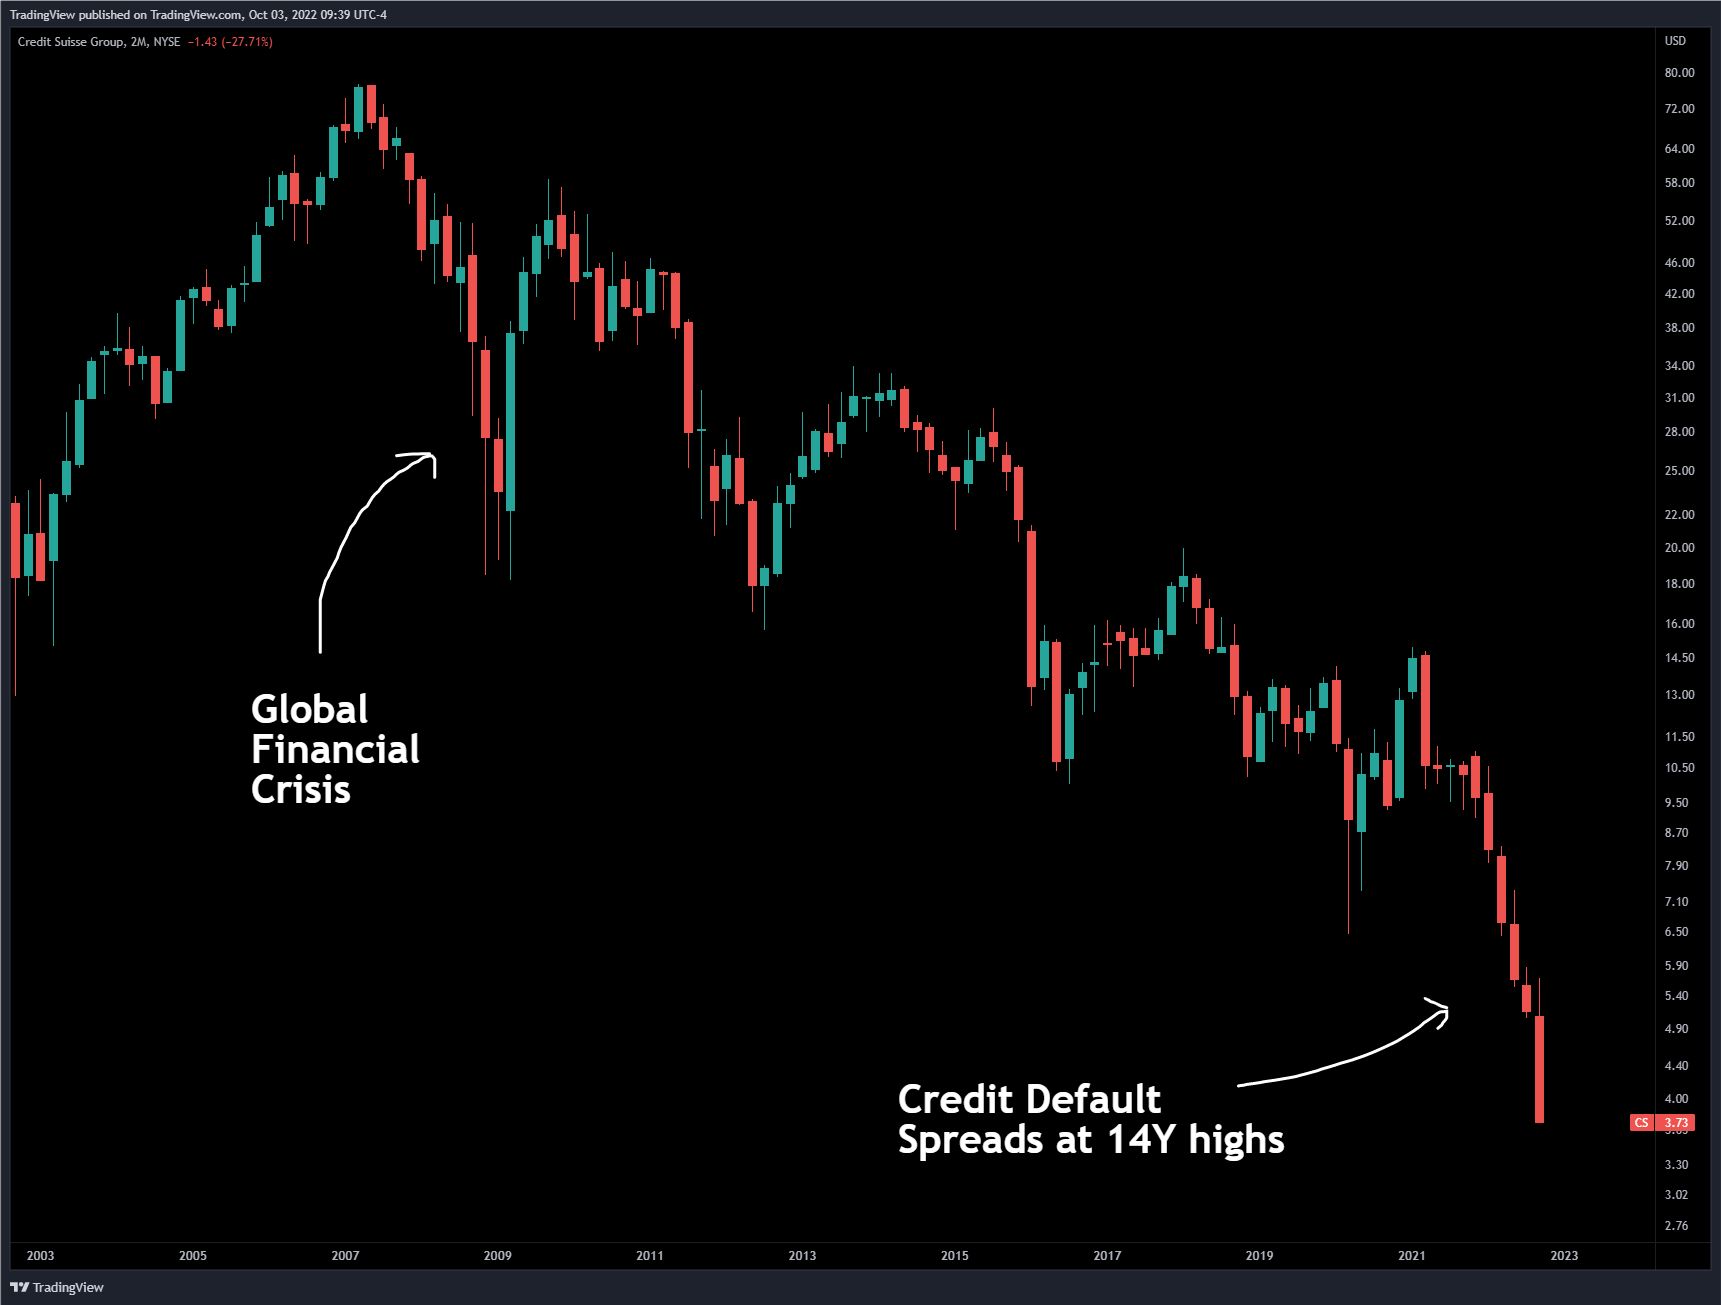
Source :TradingView
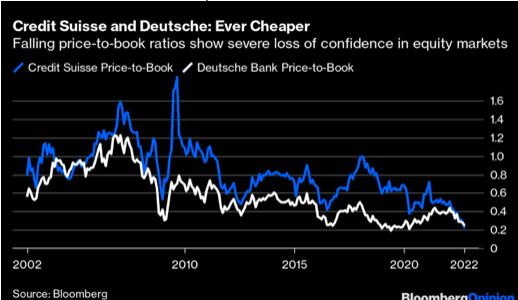
Deutsche Bank and Credit Suisse are both now trading at less than 25% of their book value, but Credit Suisse has set a new low (unlike Deutsche), and for the first time since before 2008 now has lower book multiple.
Credit Suisse’s CDS has risen to levels to match anything that hit it in the post-Lehman era, and it now far exceeds the implicit default risk of UBS. Debt and share prices like this only make sense if these is a significant move in both the equity and credit markets to position for the risk of a default by Credit Suisse. Any such event would open the possibility of Lehman-style damage.
Long-Term Investors should use any rally to reduce portfolio risk and raise cash levels for now. As noted, markets are oversold enough for a tradeable rally back to the 50-dma, and while the market could rally further, don’t try and time the exit.Sell into the rally as it proceeds. When the rally eventually reverses, you will have reduced risk accordingly. We expect to see lower lows before the final market bottom, coinciding with a significant volatility spike and reversal of Fed policy.
Oil
The atmosphere remains heavy on oil markets, which nevertheless recovered at the end of the week. Still penalized by fears of recession, the WTI traded below USD 80 and is now at around USD 82. Meanwhile, OPEC is reported to be considering a major production cut at its upcoming meeting on Wednesday.
Cryptos
Bitcoin has been moving slightly higher since the beginning of the week, hovering around $19,500. For the month of September, the digital currency, down 3% from the previous month.
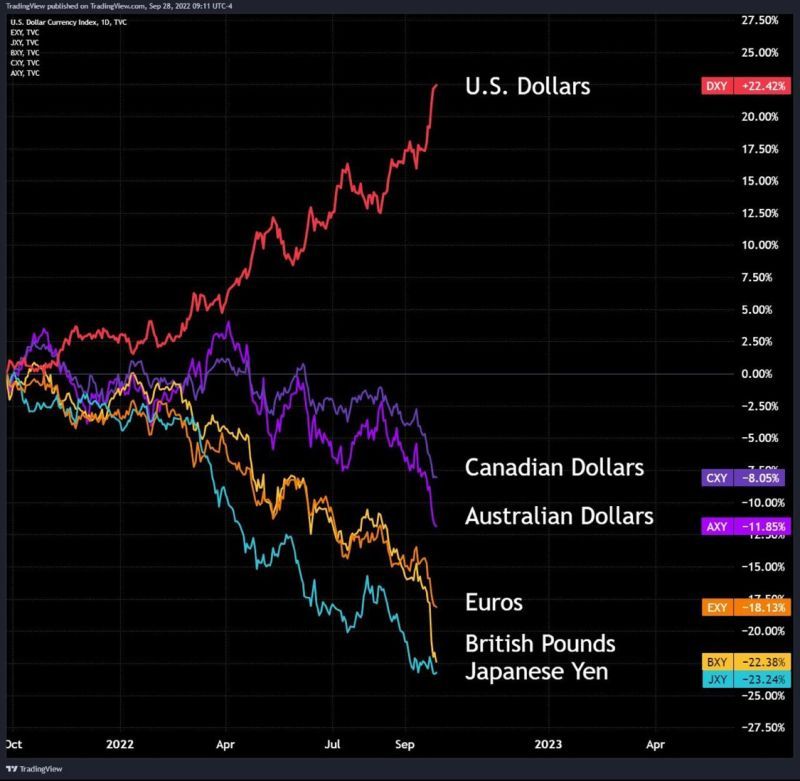
King Of Kings: The U.S. Dollar
What we’re seeing playing out before our eyes is “The Dollar Milkshake”, a concept invented by Santiago Capital’s Brent Johnson, back when it used to be “The Dollar Milkshake Theory”. It was the idea that as the US Fed tightened monetary policy and (tried to) reduce the money supply, the US dollar would become “like a wrecking ball” in foreign exchange markets, as all other currencies would sell off and weaken against the USD, which Johnson sees becoming a global hedge against everything else.
The Washington Post likened The Dollar Milkshake Theory, (and the dollar bulls who subscribed to it), to “a cult” as recently as three months ago.
Today, this is now known as The Dollar Milkshake Reality.
The “recent move in the US dollar creates an untenable situation for risk assets that historically has ended in a financial or economic crisis, or both,” equity strategist Mike Wilson said. “While hard to predict such ‘events,’ the conditions are in place for one, which would help accelerate the end to this bear market.”
“In the meantime, we remain convicted in our eventual low for the S&P 500 coming later this year/early next between 3000-3400 (in line with our base and bear case tactical views, respectively),” Wilson said.
“On a year over year basis, the DXY is now up 21% and still rising,” he added. “Based on our analysis that every 1% change in the DXY has around a -0.5% impact on S&P 500 earnings, 4Q S&P 500 earnings will face an approximate 10% headwind to growth all else equal.”
“This is in addition to other headwinds we have been discussing for months – i.e., payback in demand and higher costs from inflation to name a few. It’s also important to note that such US dollar strength has historically led to some kind of financial/economic crisis.”
“What’s amazing is that this dollar strength is happening even as other major central banks are also tightening monetary policy at a historically hawkish pace,” Wilson said. “If there was ever a time to be on the lookout for something to break, this would be it. Like our rates team, our currency team raised its forecast for the USD. On a DXY basis, they are now forecasting a year-end target of 118, which means no relief in sight, at least fundamentally speaking.”
“In our view, such an outcome is exactly how something does break, which leads to MAJOR top for the US dollar and maybe rates, too. However, until that happens, we think the screws will only get tighter for earnings growth and financial conditions.”
(From Seeking Alpha)
Capitulation coming?
“US rates are rising as the market reprices peak Fed Funds higher, and equities are being repriced lower” Societe Generale macro strategist Kit Juckes said. “This has all the hallmarks of the start of the final stage of the dollar’s rally (a stage which has the capacity to be violent and volatile).”
From a technical standpoint, the dollar index has room to move up to 120 (it stands below 112 at the moment), but that it at least needs to pause for equities to bottom.
All this noise…
…is a way to peg the Euro, pound and dollar 1-1 That way it is an easy to sell the Idea of combining them…create a CBDC to compete with the China/Russia/India alternative… BOE buying bonds to control the peg to the dollar.
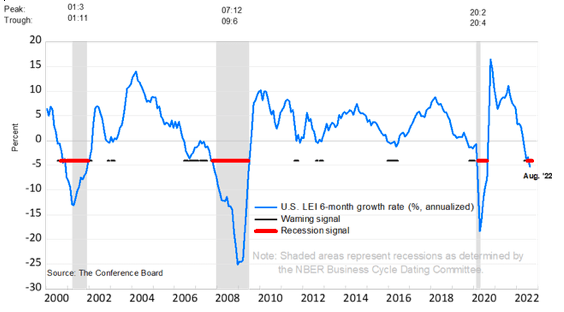
The Creeping Recession
The Index of Leading Indicators is a composite of multiple economic reports for things like employment, consumer spending, and manufacturing orders. The indicator went negative back in July—but just barely. The latest report for August fell further into negative territory, marking the first time there were multiple negative readings since right before the pandemic. Of course, this doesn’t necessarily indicate a recession is forthcoming. It did go negative well in advance of the financial crisis as well as before the COVID-induced recession, but a recession didn’t follow the brief dip into negative territory in 2016. With that said, many investors that watch this index think it’s a cautionary signal.
One of the charts we featured was the Conference Board’s chart on the Leading Economic Indicators. Last month it was approaching a warning sign. Bad news, today they say we are now in an official recession.
A global recession probability model by Ned Davis Research recently rose above 98%, triggering a “severe” recession signal. The only other times the model’s been that high was during previous acute downturns, such as in 2020 and 2008-2009, according to the firm’s Alejandra Grindal and Patrick Ayres.
“This indicates that the risk of severe global recession is rising for some time in 2023, which would create more downside risk for global equities,” they wrote in a note
.
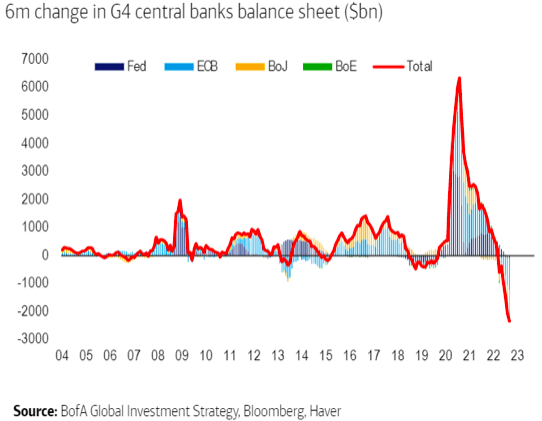
Another factor to consider is quantitative tightening, famously known as QT. The following chart shows an exercise by Hartnett at BofA to sum changes in central banks’ balance sheets across the world. On this basis, the tightening pressure is on a scale never seen.
Interest rates alone can destabilize an economy, but when combined with a surging dollar and inflation, the risks of market instability increase markedly.
Bank of England Pivots First, Fed to Follow
FED officials getting increasingly worried about “financial stability” as opposed to inflation as higher rates begin to crush bonds. Fed growing worried about possible “Lehman Moment” with a 4% rate as Bonds and derivatives tied to them crash, given the enormous debt issued in just the past 3 years at super low rates. A Fed watcher said the UK intervention was not “a one off” and the same systemic risk could happen here, which might cause the Fed to pause.
U.K. bond turmoil forced the the Bank of England to step into the market as government borrowing costs surged amid fears of the government’s tax-cutting plans. The central bank suspended the planned start of its gilt selling next week and said it would temporarily buy long-dated bonds, scooping them up on “whatever scale is necessary.” The yield on the 10-year gilt tumbled in response, falling 36 basis points to 4.15%, while pound sterling rose above $1.08, before quickly wiping out those gains.
The Bank of England said in a statement. “In line with its financial stability objective, the BoE stands ready to restore market functioning and reduce any risks from contagion to credit conditions for U.K. households and businesses.”
Happy trades
Bonus : SEE YOU IN OCTOBER
She’ll be alone each and every night
While you’re trading your ass away, don’t forget to write
Bye-bye, so long, farewell
Bye-bye, so longSee you in October
See you when the sucker’s rally’s through
Here we are (bye, baby, goodbye)
Saying goodbye at Wall Street station (bye, baby, goodbye)
The sucker’s defenestration (bye, baby bye, baby)
Is taking you away (bye, baby, goodbye)Have a good time but remember
There is danger in the sucker’s moon above
Will we see you in December?
Or lose you like Michael Jackson’s glove
(counting the days ’til you’ll be through)
(counting the hours and the minutes, too)Bye, baby, goodbye
Bye, baby, goodbye
Bye, baby, goodbye (bye-bye, so long, farewell)
Bye, baby, goodbye (bye-bye, so long)Have a good time but remember
There is danger in the sucker’s moon above
Will we see you in December
Or lose you like Michael Jackson’s glove(You’ll be on the phone each and every night)
(While you’re short term gains are drifting away, don’t forget to write)
See you (bye-bye, so long, farewell)
In October (bye-bye, so long, farewell)We’re hopin’ We’ll See you (bye-bye, so long, farewell)
In December (bye-bye bonus, so long, farewell)
Well, maybe I’ll See you (bye-bye, so long, farewell)
In December (bye-bye bonus, so long, farewell)
WilliamBanzai7
based on
See You in September