

MARKETSCOPE : The Market is Always Right
August, 15 2022
Bull Or Bear Market?
This comment from Bespoke Investment LLC sums up the mood by the end of the week:
“After a strong jobs report last Friday reignited fears of an overheating economy, markets were edgy heading into a busy week for inflation data. It doesn’t happen that often, but bulls hit the inflation superfecta. It started with Monday’s release of the July Survey of Consumer Expectations which showed a continued decline in inflation expectations. On Wednesday, the big bad CPI report for July was released and that came in lower than expected for a change. The weaker-than-expected CPI was followed by a weaker PPI Thursday and then a weaker-than-expected report on Import Prices Friday. After months where it seemed as though every inflation report was coming in hot, this week’s data on prices was cold, cold, cold, and cold. The heat wave has been broken!”
 Last week good news on inflation, which came out at 8.5% year-on-year in the US, lower than the 40-year old record set in June at 9.1%, might signal the beginning of an inflection, which will perhaps be confirmed in the weeks to come, allowing us to say that we have finally passed a historical peak.
The idea that it could point to a less aggressive intervention by the Federal Reserve in September pushed financial markets higher last week, with strong gains Friday after the monthly report from the University of Michigan showed a surge in consumer confidence, marking the second consecutive gain for the index since its June low.
All the sectors in the S&P 500 advanced, led by energy stocks. Small caps outperformed large caps. In Fixed Income, the US yield curve steepened as the front-end eased while longer-term yields rose modestly.
In Europe, the STOXX Europe 600 Index ended the week 1.2% higher as fears of more aggressive interest rate hikes eased. Industrial production in the euro area rose for a third consecutive month in June. Months of drought in Europe are severely affecting energy production, agriculture, and river transport.
Risk appetite seems to be intact for the time being, despite the looming recession. The overall better-than-expected corporate results have kept the buying current going during this summer period.
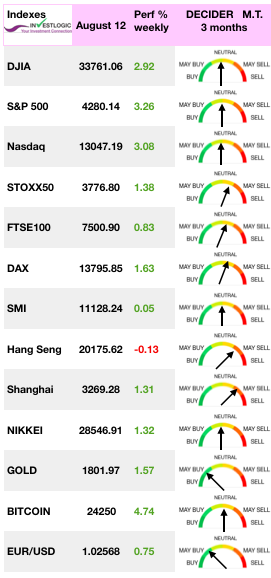
MARKETS :
There are data supporting both bull or bear market arguments. The challenging part for investors will be navigating the markets safely over the next few months until the “tale is told.”
Bull case
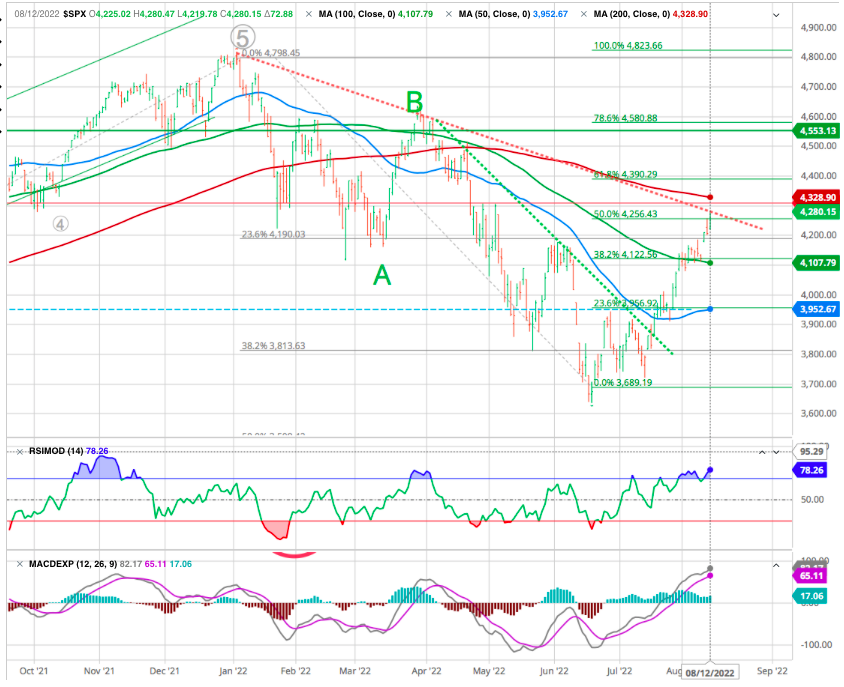
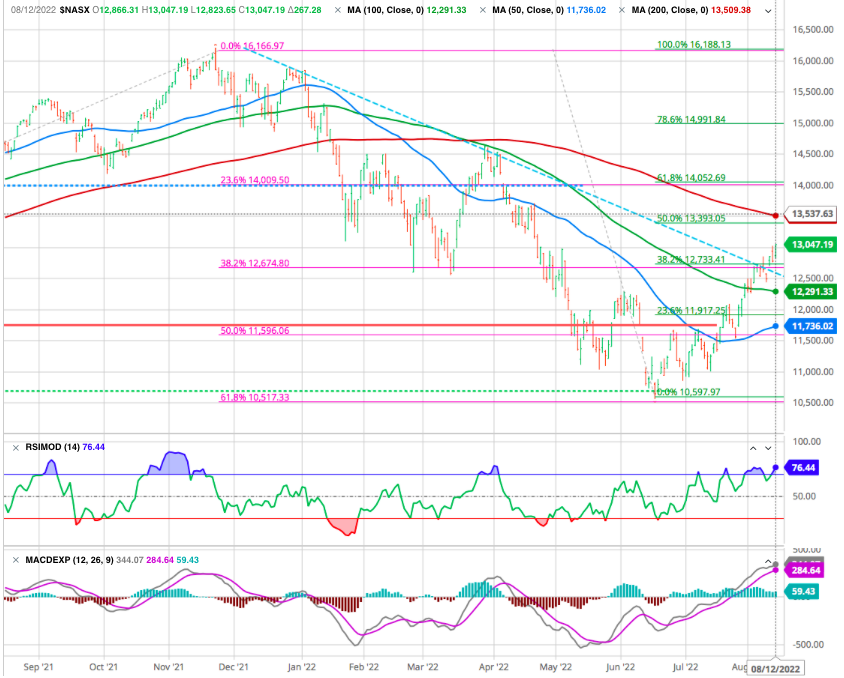
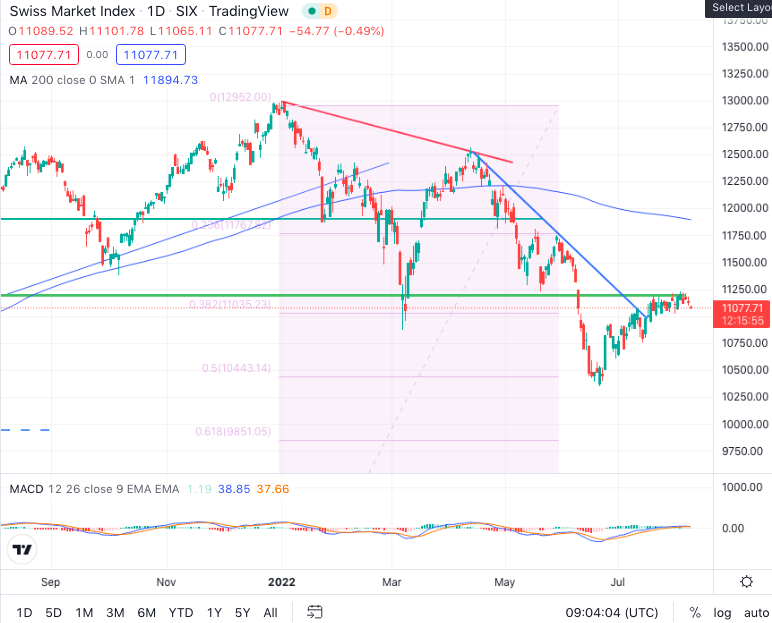
There is a bullish bias to the market, with sentiment improving sharply in recent weeks. With the market clearing the 100-dma and the 20-dma crossing above the 50-dma, precise short-term support levels will provide better entry points for increasing trading positions. While the market is pushing a rather extreme deviation above the 50-dma, the 200-dma is acting as a magnet for investors, which will likely be achieved this week. Note that is also on the downtrend line and the 50 % Fibo retracement !
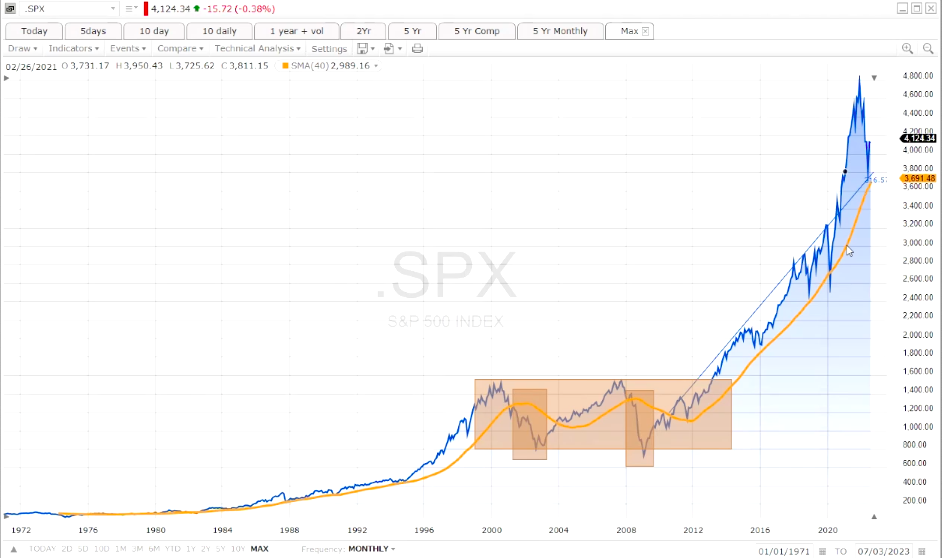
But an even more bullish chart comes from a monthly perspective. As shown, the market decline bounced solidly off of the 3-year moving average. Such is an essential point as it tells us that the current decline was a “correction” and not a “bear market” since the market did not violate bullish price trends.
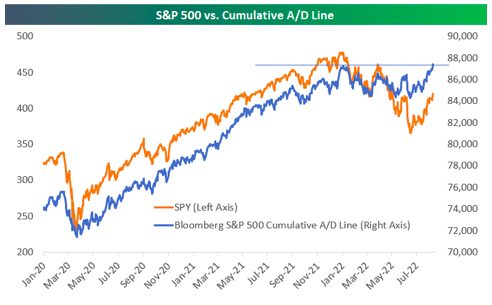
The S&P 500 has had quite an impressive run lately with a 15% gain since the mid-June low. While the index remains more than 10% below its all-time high seen on the first trading day of 2022, two charts related to market internals comfort our short term trend. –
The first is the S&P 500’s cumulative advance/decline line tracked by Bloomberg. This indicator adds up the daily number of advancers minus decliners over time and is used to gauge underlying breadth during rallies and declines. Notably, Bloomberg’s cumulative A/D line made a new high yesterday even though the S&P would need to rally 13% to get back to new highs. This represents a significant positive divergence between breadth and price.
The second chart that stands out is the percentage of S&P 500 stocks trading above their 50-day moving averages. This reading dipped below 2% back on June 16th but has risen up to 88% in less than two months. As shown below, 88% is the highest level seen since the spring of 2021.
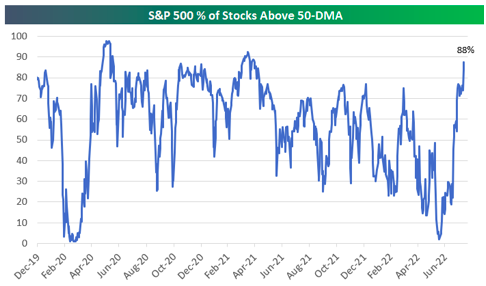
source Bespoke Investment Group-
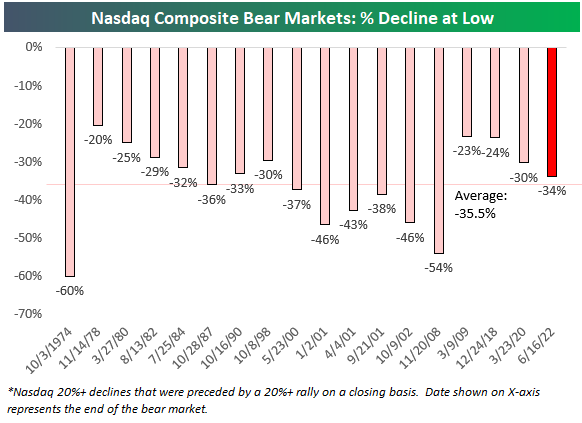
Lastly, looking at Nasdaq recent market uptrend, the current one that began on June 16th has so far seen a rally of 20.7% over 55 calendar days.
Historically, Nasdaq bulls have seen a gain of 135% over 841 calendar days, while the median bull market gain has been smaller at 73.3% over 485 calendar days. To get to the “median” bull for the current rally, the index would need to rally another 43% over the next 430 days through mid-October 2023. Wouldn’t that be nice?!
So it was not surprising to see Nasdaq surge 300 points as the Fed Fund futures moved from a 70 to 35% probability of a 75 basis point rate hike in the September FOMC. In essence, the Street has moved to a 50 basis point consensus in September and a 3.5% year end policy rate target. A less draconian expectation on Fed rate hikes is bullish for growth stocks and some of the Nasdaq megacap favourites have jumped 25 to 40% since the June 16 lows.
Yet the real action in mid-June has been in Nasdaq’s best and brightest (ok, the biggest), led by Apple and Mr. Softy while the index alone has risen a spectacular 20% at a time when the bears howling for blood control the narrative.
While Apple and Microsoft led the bounce since mid-June, both trade at a 28 to 29X valuation multiple now, so we would rather find Cinderella sectors and companies where the risk/reward calculus is far more skewed in our favour for new money. Regional banks, semicons, industrials and defence are favorite bargain hunting parish.
One area of the market that has been in focus this week is semiconductors. As a key area of the largest weighted sector (Tech) in the S&P 500, the semis are often considered to be a leading industry similar to the way the Dow Transports has been in the past. In other words, semis can often be used as a way to confirm a broader market move.
Unfortunately semiconductor stocks have gotten pummeled over the past few days leading the sector’s relative strength versus the S&P 500 to reject its downtrend line. That means the trend of underperformance of the semis remains firmly in place after the group showed strength earlier this summer.
Chart of the week : ON SEMI
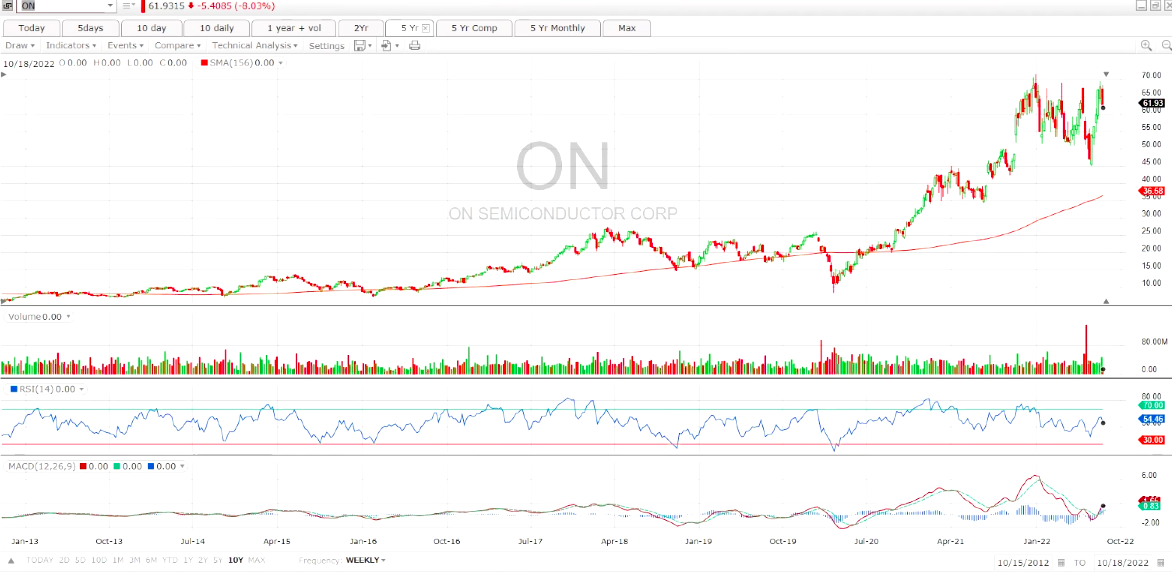
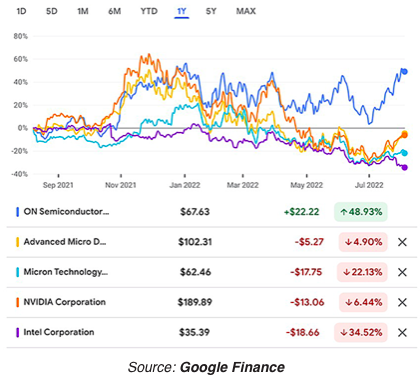
Over the past year, while semiconductor stocks as a whole have struggled, ON has provided double-digit returns.
In more recent news, ON just recorded its first-ever $2 billion revenue quarter, which was a 25% increase from the same time last year, and demand is outpacing supply for its automotive and industrial segments.
Looking ahead, the company expects to generate between $2.07 billion and $2.17 billion in the current quarter; analysts expected it would generate $2.02 billion.
This performance shows the company has been able to not only weather volatile markets but even make its shareholders profits, which is good to know if things get even choppier.
Bear case
As is always the case, the bearish argument is grounded more in the macroeconomic, monetary, and financial fundamentals. While the bulls are ramping up equity risk in hopes of a “Fed pivot,” there is little indication from the Fed that such is likely anytime soon. In fact, from a historical perspective and even recent comments, the Fed’s focus is singular on bringing inflation down to its 2% target.
Phase 2 of The Bear Market is going to be more about REAL GDP and PROFIT GROWTH slowing into their respective recessions for the next quarters.
When it comes to equity risk it is corporate earnings that will drive equity prices. As the Fed hikes rates to slow economic activity and potentially cause a recession, such will translate into slower earnings growth and reduced profit margins. Given that valuations are near 30x earnings currently, such suggests that stocks will need to reprice lower. The 6-month annual rate of change of the Leading Economic Index (LEI) supports that thesis, suggesting earnings will decline over the next two quarters.
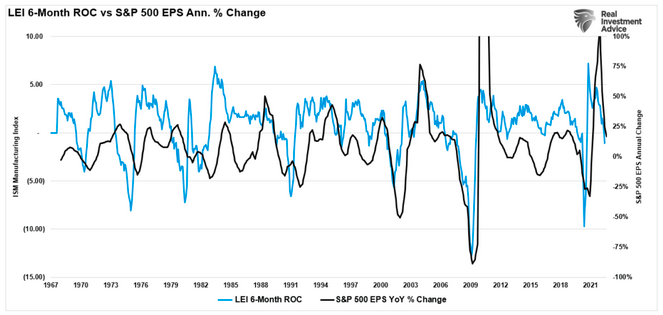
When you discount future earnings with higher interest rates, it produces lower growth and less profitability from an expectation perspective.
Irrational exuberance may be prompting the latest market rally. Quality is key to selecting stocks, especially following positive news, which is why I emphasize fundamentals and focus on key characteristics like valuation, growth, momentum, profitability, and EPS revisions before selecting stocks for a portfolio.
Whether the bull or bear market view wins out will only be found out in time. However, as noted, while the bulls currently control the technical picture, the Fed still has control of the macro environment. While we will continue to trade the markets tactically in the short term, in our view, there is still a risk of a more profound decline unless the Fed changes course in short order.
The current market environment remains very challenging. We remain highly vigilant to the current climate where the bulls cling from one report to the next in hopes of a reprieve from the Fed. However, we suspect such won’t come soon, and the risk of disappointment remains elevated. But, as always, we remain focused on what the market is telling us.
Before taking action for fear of missing out (FOMO), consider evaluating your stock pick(s)
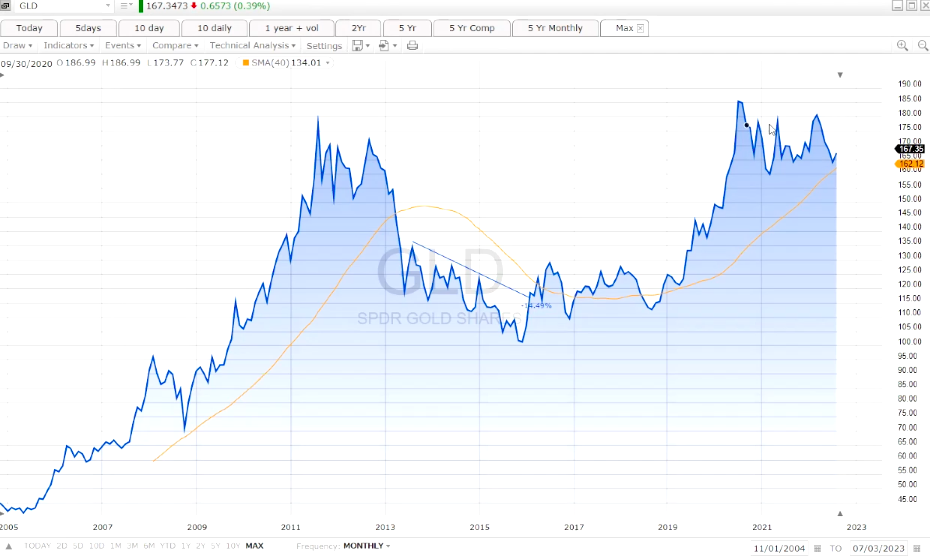
Gold
The mood in the precious metals segment is still one of rebound.
The return of risk appetite, palpable in recent sessions, is benefiting gold buyers. The barbarian relic is trading around USD 1793. Industrial metals are also gaining some ground since the latest Fed rate hike.
CRYPTOS
In the wake of U.S. stock indexes, bitcoin continued its ascent this week and is now hovering around $24,000 as of this writing. For its part, ether is clearly outperforming the market leader, rising 6 times since the beginning of August. ETH is thus back to sailing around the $1,900 mark after having passed under the psychological threshold of $1,000 in June. A crazy progression that can be explained above all by a renewed appetite of investors for risky assets in recent weeks.
Swiss stock market
SMI is struggling agianst its resistance at the level 11250 which is also close to the older 38.2 % Fibo support.
INFLATION PEAK ?

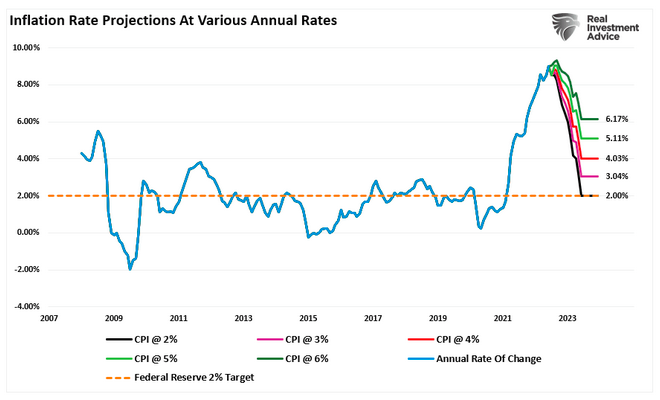
While the market believes that peak inflation and peak hawkishness could be behind us; to our opinion, this seems to be too complacent. While inflation might be near its peak, it is likely to stay above central banks for a sustained period of time, hence forcing central banks to maintain a hawkish stance for a longer period than what is currently factored in by the market.
It’s reasonable to think that the peak for headline inflation — including food and fuel and everything else — is behind us.
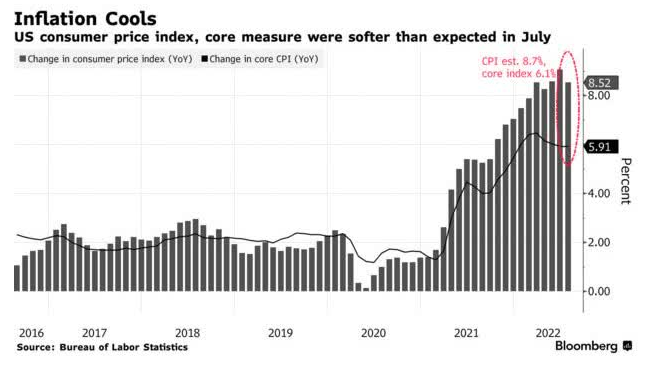
However, even if the peak has been scaled, the issue of the descent now confronts us. And it will be difficult. Although undeniably positive, this consumer price index report is not a big game-changer, and it’s unlikely to have much impact on how the Federal Reserve behaves for the rest of the year.
Even if CPI prints at 0.2% every month, it will take until the end of 2023 for inflation to decline to the Fed’s target.
Happy trades