Weekly Market Wrap as of June 15
June, 17 2013Hear the Bond Markets Howl
 Both the Fed’s “tapering” and ECB’s “open mindedness” regarding a negative deposit rate were types of forward guidance. Of course, the key is how the market responds to the FOMC statement. We have consistently argued that the Fed is unlikely to taper as early many participants and observers have suggested: Not in June, the summer or September. Our base line view was for a tapering late this year, but see a strong case to be made for allowing the next Federal Reserve chairperson have the distinction; partly on economic grounds, and partly drawing insight from game theory. We recognize the desire to enhance the Fed’s anti-inflation credentials after a prolonged period of unorthodox and extensive easing of policy.
In notable economic news this week, the Labor Department reported initial jobless claims declined by 12,000 last week to a seasonally adjusted rate of 334,000 claims. This marks a new five year low and reinforces the belief that the US labor market is healing as well as what the Wednesday next Fed meeting might bring.
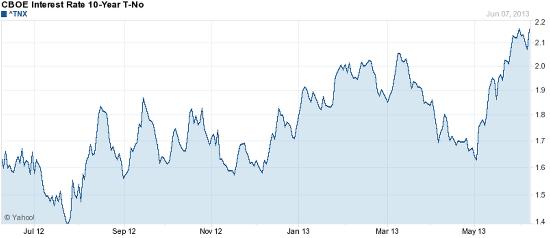
Friday was one of those days when so many markets move so dramatically that it’s hard to know what to focus on. But in this case the headline numbers – US stocks way up, gold way down, foreign markets all over the place — matter less than the interest rate on 10-year Treasuries, which spiked.
The reason this number matters is that a return to “normal” times of high employment and fast growth also means a return to normal interest rates, which would be about twice current levels. This creates one or two little problems for a society with trillions of dollars of debt to roll over each year. Already, with the 10-year moving just from 1.7% to 2.2%, the junk bond market is suffering
The “Perfect Storm”
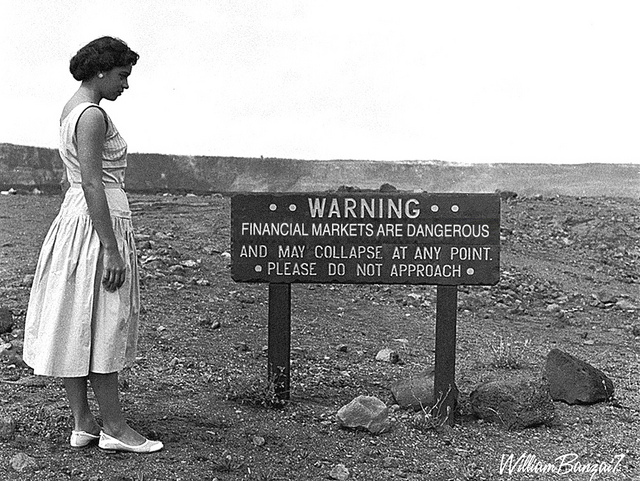
What would be the “Perfect Storm” for most portfolios? For stocks and bonds fall at the same time!
The 2-pack below highlights a couple of key support lines for bonds and stocks that are being pushed on very hard! If this action continues, it would hurt the value of many portfolios!
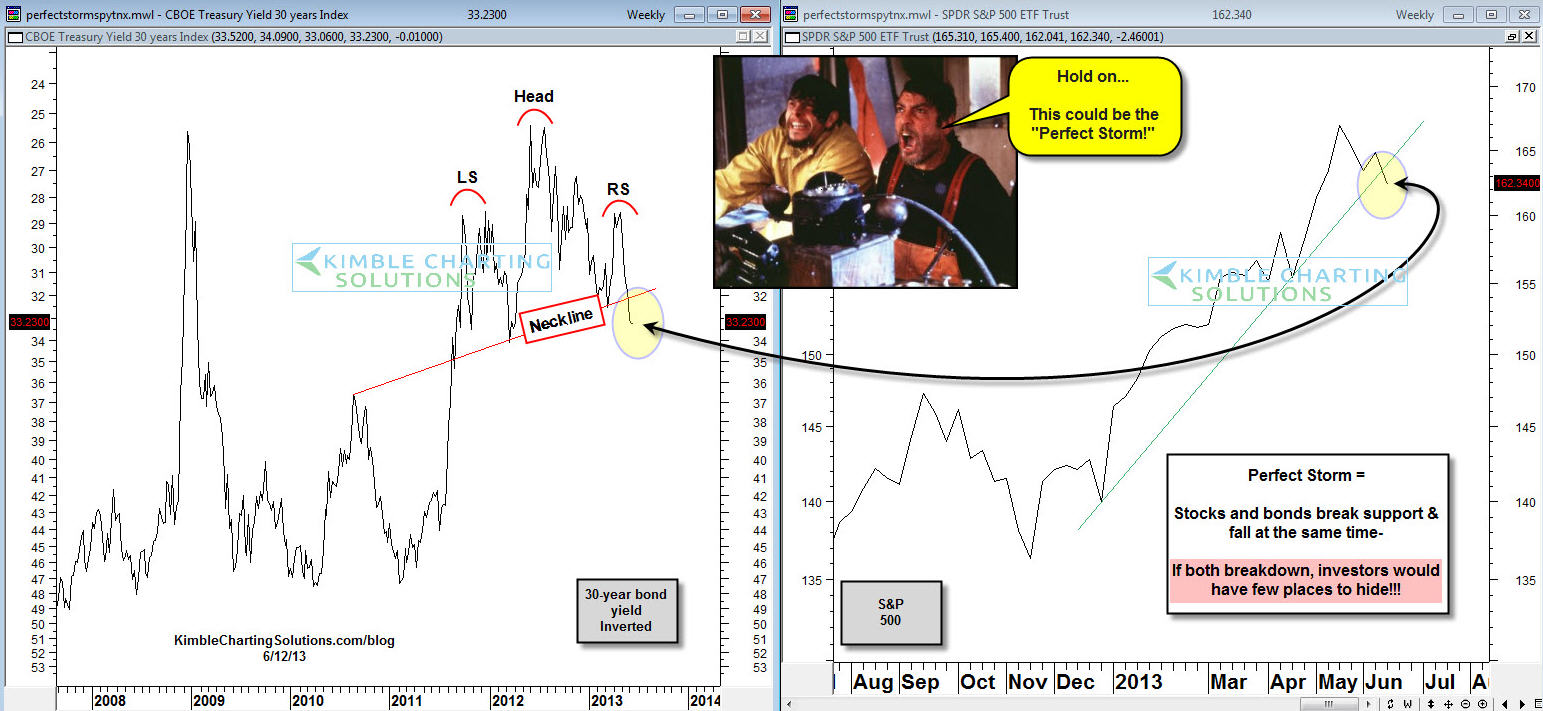
The odds of this happening are very low, but the impact would enormous if the twin breakdown takes place! But banks will see this is a warning that massive QE can have unintended consequences. -See comments below –
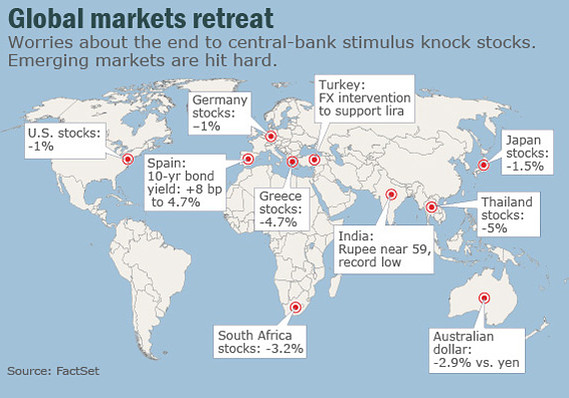
Equities : All eight indexes on our world watchlist were down for the week. The top performing S&P 500 fell 1.01% and the gradient of losses was a steady decline to the worst performing Hang Seng, with its 2.81% selloff over its holiday-shortened week. The Nikkei, the biggest loser of the previous three weeks (and I mean BIG: -3.47%, -5.73% and -6.51%), finished in third place last week with a more modest -1.48%, which illustrates the power of Abenomics to levitate the Land of the Rising Sun to its interim high on May 22, followed by a sudden and dramatic selloff. I continue to wonder if central central banks will see this is a warning that massive QE can have unintended consequences.
BRIC Stock Market Performance Ranking with the Brazilian Market Lagging The table below is the percentage change of the BRIC stock market indexes against the 89-day exponential moving average (EMA89), also incomparison to the US market. Currently the Brazilian market is lagging.

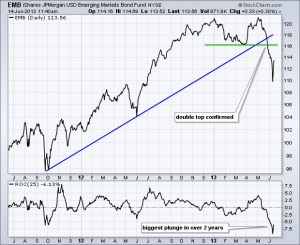
Bonds : The iShares Emerging Market Bond ETF (EMB) formed a double top from December to May and confirmed this pattern with a support break in late May. Notice that the ETF fell over 8% as rumors of Fed tapering hit the market. This decline reflects some serious chaos and surely rattled some big portfolios.
Get ready for 4% bond yields, ‘quite ugly days’
Bond yields are headed near 4% and not even Fed Chairman Ben Bernanke can stop the “inevitable shock” that’s coming. That’s a fresh view from Goldman Sachs’s former chief economist Jim O’Neill, writing an op/ed column for Bloomberg on Wednesday, entitled, “Can Bernanke avoid a meltdown in the bond market?”
Outflows from bond funds running at fastest pace ever. We estimate that bond mutual funds have lost $23.4 billion this month, while bond exchange-traded funds have redeemed $7.1 billion. The combined outflow totals $30.5 billion—and the month is not even half finished.
Currencies : The US dollar lost ground against all the major currencies over the past week. The yen (3.5%) and New Zealand dollar (2.0%) led the pack against the greenback. Canada, Australia and Norway were the laggards, the worst was flat and the best–up almost a percent. The dominant story is really the weakness you’re seeing in commodity currencies that is part of this selloff in risky currencies more broadly, that’s been led by the emerging world. The dollar has a much deeper retracement of its gains against the Swiss franc in recent weeks.
Outlook before Fed Tightening
What does it mean, see our paper here
What to expect : “Greater market volatility forcing more formulaic and VAR-based accounts to reduce positions in an accelerated fashion. Crossover investors trying to get back to their “home asset classes,” and finding it hard to do so in an orderly fashion. An outflow of funds from mutual funds and other accounts; and, of course, reduced willingness among dealers to make markets and, in the process, resisting to hold much inventory.”(Mohamed A. El-Erian)
Since the Fed began floating trial balloons last month about tapering its current QE program, cyclical sectors have outperformed while defensive and interest rate sensitive sectors have lagged. That is consistent with historical patterns leading up to Fed interest rate hikes, i.e. a change in Fed policy. Deep cyclical sectors have consistently outperformed the broad market in the six months leading up to an initial Fed interest rate hike. Defensive and interest rate sensitive sectors have underperformed. U.S. equity sector performance suggests that a re-pricing of Fed expectations is slowly developing.
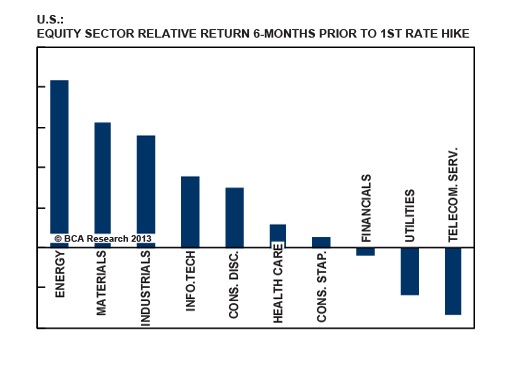
Defensive sectors include utilities and consumer staples (food and tobacco). On 19 April the utilities sector was up 8.6% year-to-date. Now however, it’s down 5.2%. Consumer staples have also sold off (though not to the same extent) on investors’ expectations that the Fed will soon scale back its asset purchase program. Meanwhile however, cyclical sectors such as energy, industries and technology have begun to perk up, and the outlook for these sectors looks positive.
Increased Volatility
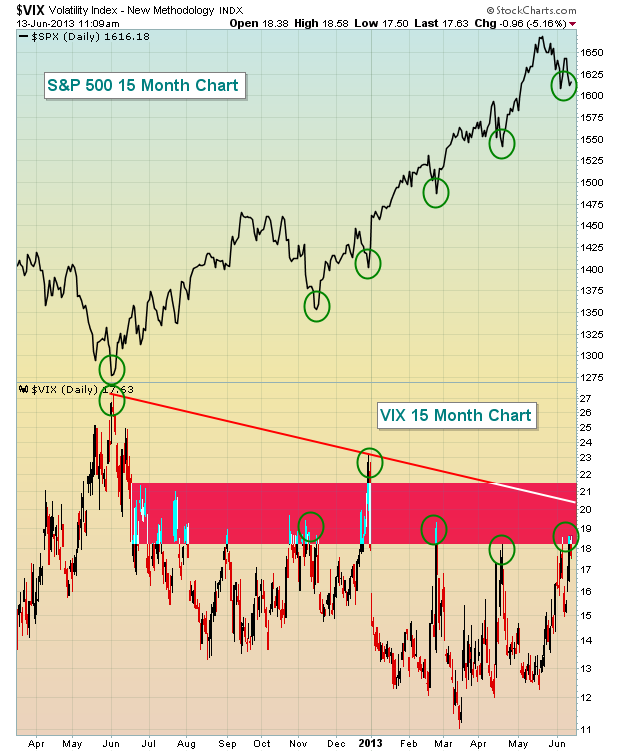
We identify a strong support at 1200 for the SPX. Volatility plays a role in any market environment, but I always look to key areas of resistance on the VIX to help identify tradable bottoms on the S&P 500. In our last reco early May we suggested that the 18-19 resistance on the VIX could prove to be key. Thus far, it has been. The VIX has hit this resistance level with the S&P 500 also sitting almost squarely on trendline, price and moving average support. If the S&P 500 were to lose these support levels, we could see the VIX push up to the 22-23 area, a much bigger level in our view.
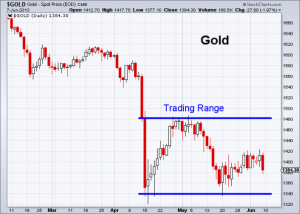
Gold in a 8-Week Horizontal Trading Range
The daily chart shows that the gold index is forming a 8-week horizontal trading range between 1340 and 1480. Prices should be in sideways before a breakout from the trading range.
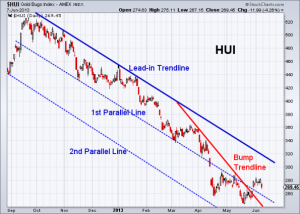
Gold/silver mining stocks are in a possible Bump and Run Reversal Bottom pattern, i.e., the exact opposite of the SPX’s “Bump and Run Reversal Top” pattern discussed above. The 6-month downtrend channel serves as a “Lead-in” phase in which prices move in an orderly manner and the range of price waves defines the lead-in height. In last two months, prices fell into the “Bump” phase with fast declining prices following a sharp downtrend-line slope with an angle large than 45 degrees.
Although prices typically could reach a bump low with at least twice the lead-in height, the price target projected at the 2nd Parallel Line is negated once prices cross above the Bump Trendline (red line). Testing the lead-in trendline should be expected. If prices break above the lead-in trend line, the bullish “Run (up)” phase could start.


