WEEKLY MARKETS REVIEW AS OF APRIL 27
April, 27 2013Take It Easy Money …
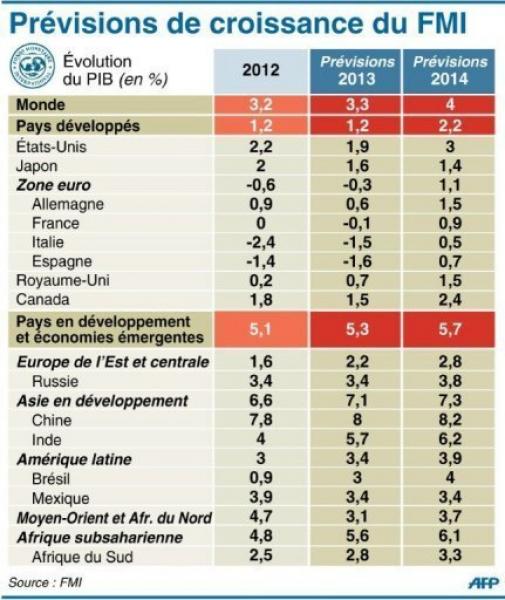
Risk appetites returned in a big way this week, following what now appears to be a brief flight to quality last week. The data flow didn’t provide many grounds for optimism. US GDP growth picked-up less than expected in Q1 and should slow in Q2 because of the sequester. Admittedly UK growth came in better than expected, but the eurozone’s recession appears likely to persist through the spring. And after unexpectedly slowing in Q1, there are early signs that Chinese growth could fall short of expectations in Q2 as well.
However, while the data are not generally supportive, monetary policy certainly is. Indeed, there seems to be a broadening sentiment in markets that the extremely easy monetary policy environment will not become less easy any time soon, and may in fact become even more accommodative.
As European macro data in the last month has plunged at its fastest rate in 6 years, equity markets have, of course soared back to near multi-year highs (EuroStoxx 600 up 5% in the last week alone). We only hope that the equity markets really do know something different this time – as opposed to the last two times we saw this kind of disconnect. The answer – Draghi’s ‘whatever it takes’ promise is maintaining a 30% illusion of wealth in European equities over their macro reality.
First, on the heels of the BoJ’s launch of its extremely aggressive monetary stimulus program, we sense a broadening consensus that the Fed will not taper its pace of asset purchases soon (we have long believed that the current $85 billion per month pace will continue all year). The BoC is also pushing out when any tightening may occur until perhaps late 2014. Finally, there is rising speculation that the ECB, and perhaps even the RBA, could be poised for further rate cuts (although we feel the latter is far less likely than the former).
Meanwhile, the fiscal austerity consensus appears to be crumbling, suggesting a shift to a less restrictive fiscal stance in many economies. Notably, the research from Harvard economists Reinhart and Rogoff “ This Time Is Different” (*see below) that purports to suggest high government debt leads to economic stagnation have been challenged. Coincidentally, many economic leaders ranging from IMF head Lagarde to the new Italian Premier Letta have concluded that there needs to be a shift away from the austerity programs that have been the focus of fiscal policy for the last few years.
Equities: A mini flash crash struck equities on Tuesday on rumors of another bombing but the recovery was swift after the rumors were quickly debunked. Equities were otherwise bid, led by Europe on speculation the ECB is poised to ease.
Bonds: Bonds also gyrated on the bombing report hoax but were otherwise mixed on the week. Italian government bonds were strongly bid (10-year yields briefly dipped below 4.00% and 2 years to a record low) on ECB cut speculation and the long overdue emergence of a new government in Rome.
Currencies:GBP were bid in the wake of a stronger than expected Q1 GDP print for the UK. JPY also caught a bid on Friday after the BoJ announced it wasn’t further enhancing monetary easing for the time being. Our near-term bias is for a stronger euro, Europe appears to have moved into the complacency phase and this phase is often supportive of the euro. At the same time we suspect the market has gotten ahead of itself in terms of an ECB rate cut. We suspect that if the market is not disappointed, a sell-the-rumor, buy-the-fact, type of activity may be supportive of the euro even if the ECB does cut the refi rate.
Commodities:Improving risk appetites and the anticipation of continued easy money lifted oil and gold. Gold has retraced 68.2% of its recent plunge and the momentum seems to have waned as the 20-day moving average has been approached.
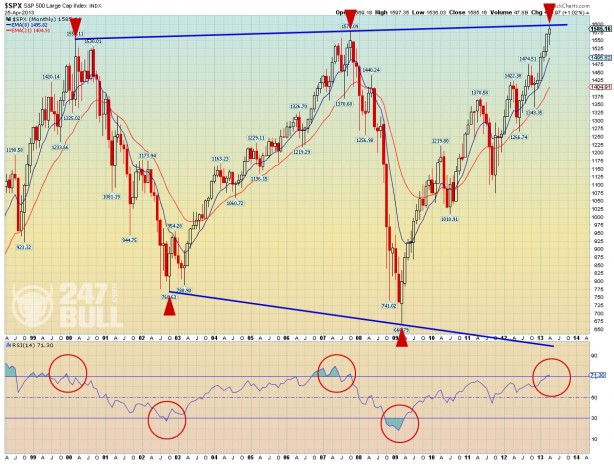
S&P 500 : A Technical Analysis Update
A long-term chart of the US equity markets reveals a market that is bumping up against major long-term resistance (blue line). The RSI (relative strength index) also shows that the S&P 500 is overbought, just as it was at the two prior major tops.
Irrationality
Credible academic research indicates that economic growth deteriorates when debt to GDP reaches critical levels – a condition that has now been met in countries that represent 75% of global GDP. When this reality is coupled with the Fed’s inability to create money growth or inflation, the result will invariably be slow nominal GDP growth.
The financial and other markets do not seem to reflect the reality of subdued growth. Stock prices are high, or at least back to levels reached more than a decade ago, and bond yields contain a significant inflationary expectations premium. Stock and commodity prices have risen in concert with the announcement of QE1, QE2 and QE3.
Theoretically, as well as from a long-term historical perspective, a mechanical link between an expansion of the Fed’s balance sheet and these markets is lacking. It is possible to conclude, therefore, that psychology typical of irrational market behavior is at play.
It turns out that not only can the Fed not control the money supply, it can’t control the velocity of money either. And that means the Fed can’t create rising aggregate demand. As in, Ben’s shooting blanks.
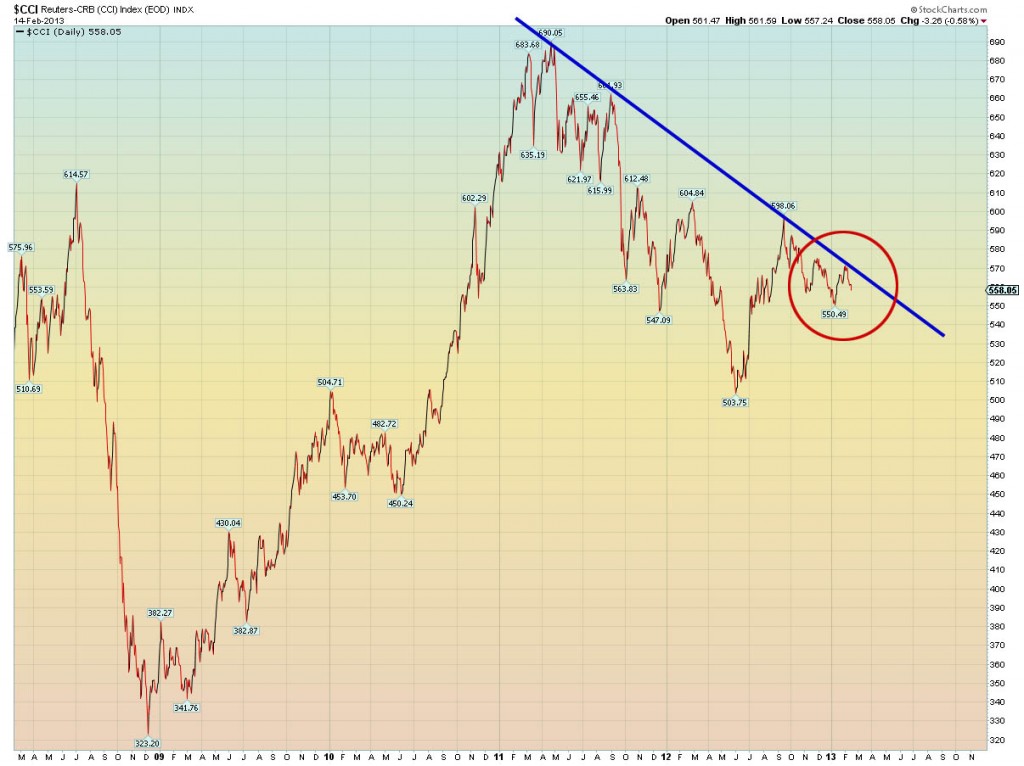
This suggests that when expectations shift from inflation to deflation, irrational behavior might adjust risk asset prices significantly. Such signs that a shift is beginning can be viewed in the commodity markets. The CRB Commodity Index peaked about two years ago at 691, but now stands at 551, a 20% decline despite massive Fed balance sheet expansion. The ability of the Fed to arrest a downside irrational move in risk assets may be limited. Non-risk assets, such as long dated U.S. treasuries, should benefit from this shift in perception.
Is Deflation a Continuing Risk?
In their pioneering work, This Time is Different, Carmen Reinhardt and Kenneth Rogoff (R&R) found that “In Depression-era defaults, deflation was the norm.” They, however, observed situations where extreme over indebtedness was followed by high inflation. For all its valuable contributions, R&R’s sample in this best selling 2009 book included both advanced and emerging economies. In later studies other researchers also separated advanced from emerging economies because the latter have options that the former do not. The emerging markets and very small economies in general can resort to currency devaluation when they become over-indebted which creates domestic inflation. Such adversarial action may succeed because the individual countries are too small and insignificant to harm others and thus would not evoke immediate retaliation. But inflation is optional for these smaller countries only. If advanced economies choose currency devaluation (“economic warfare”) to deal with a debt overhang, this evokes retaliation and a “race to the bottom” that is globally deflationary (the 1927 to 1939 experience). As far as we know, all the debt studies of the past three years have confined statistical examination to the data on advanced economies, a procedure that is now widely supported.
Of course, when talking about deflation in this context we are talking about asset price deflation rather than monetary deflation (which is the true definition).
With just about every central bank already pumping liquidity into the global economy there is virtually no chance of seeing a true contraction in the money supply. However, if economic conditions continue to worsen we can expect even greater inflationary countermeasures from policymakers.
One likely next step is for the Fed and other central banks to force banks to loan the new money into the economy. It is also likely that we will see central banks purchase assets other than bonds and mortgaged-backed securities (MBS).
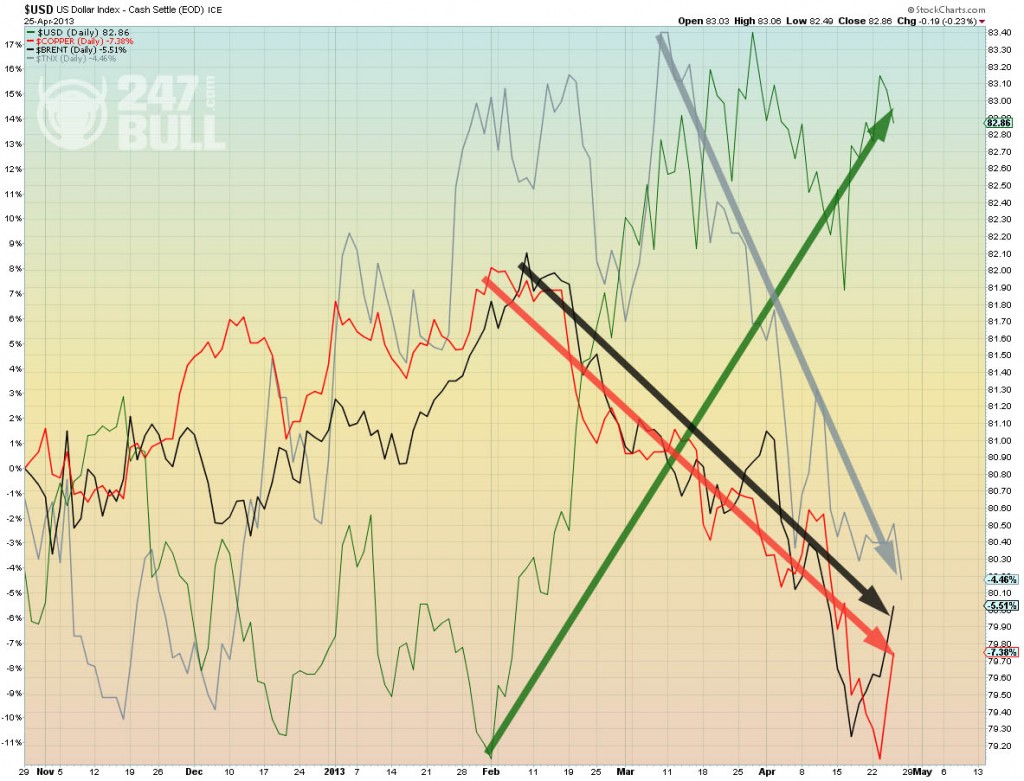
In periods of deflation cash is king and that cash gravitates to the senior currency, i.e. the US dollar, and the “safest” and most liquid form of debt, i.e. US Treasuries.
The chart below shows that during the past 11 weeks this is exactly what we have seen. Not only has the flight to safety pushed up the value of the dollar (green arrow), it has also brought down the yield on the 10-year Treasury bond (grey arrow). The chart also shows the price of copper (orange arrow) and the price of crude oil (black arrow) – two other indicators of deflation, and both show strong downtrends.
Note :
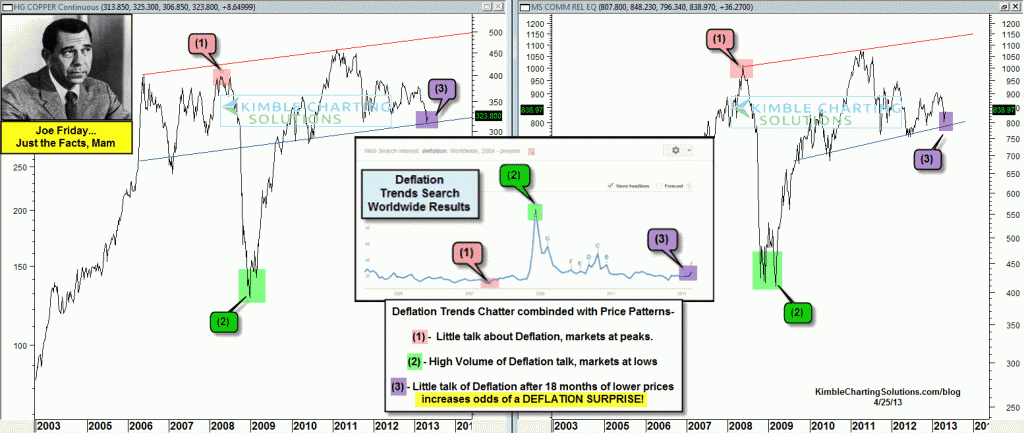
In 2007, when stocks (S&P 500) and commodities (CRX Index/Copper) were peaking there, was little talk about deflation from the media around the globe (inset chart point 1). The future reality? The majority was surprised as the S&P 500 fell 50% and Commodities fell further.
In 2009, after a large decline in stocks and commodities the, talk of deflation was very high (inset chart point 2). The future reality? The majority was surprised as the S&P 500 and Commodities rallied over 100% in the following years.
What about now? Since May of 2011, the broad based Commodities index (CRX) and Copper have declined over 25% each. Wouldn’t you expect that, with declines of this magnitude in commodities and in the Gold & Silver complex, the talk of deflation would be picking up? IT’S NOT!
Away from the idiocy of Big Rotation: Raw materials are at the lowest, funds begin running away out of Emerging markets, emerging stock markets did not follow the American rally, Australia is in trouble, the raw materials big producers begin deleveraging, the Chinese stock market is the canary in the mine!
The come back of deflationary forces by periphery is hidden by the flood of liquidities inbound from Japan. These Japanese liquidities subscribe the European loans. Kuroda’s plan to this point is a failure, sales of JGB are very bad, instead of pushing interest rates lower, the trend is rather to go up despite of the huge percentage taken by BOJ.
Where is the deflation talk/concerns after a 25% decline, with key inflation indicators at support that that could break at any time?
Is it a stretch to think we could have a period of deflation in the near future, despite the efforts of the Central Banks to stimulate the economy? I understand and appreciate concerns/arguments towards the inflation/hyperinflation side of the equation.
“If support in the CRX and Copper give way, increased selling pressure will ensue, suggesting a new round of deflation is at hand. And it will surprise a good deal of the crowd.”
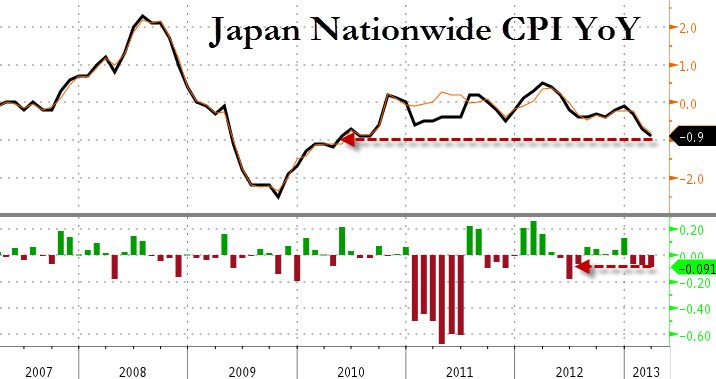
Abenomics Leads To Worst Core Deflation In Three Years
Six months in and a 30% devaluation in the JPY and it would appear Abenomics is not having quite the desired effect. With an oh-so-exciting 2% inflation target that we are sure will be appearing any second now, Nationwide CPI just printed -0.9% YoY – its worst (most deflationary) levels since April 2010, missing expectations by the most in 10 months! But wasn’t Abenomics supposed to be… inflationary? Well it is in one place – Utilities costs are the only sub-index higher YoY (by 2.3%) – that’s a good thing, right? Given that the only reason Abenomics will work is the propagandized concerns of inflation, this could be a problem for Kuroda (perhaps triple the monetary base will do it).


